 5
5peptides
spectra
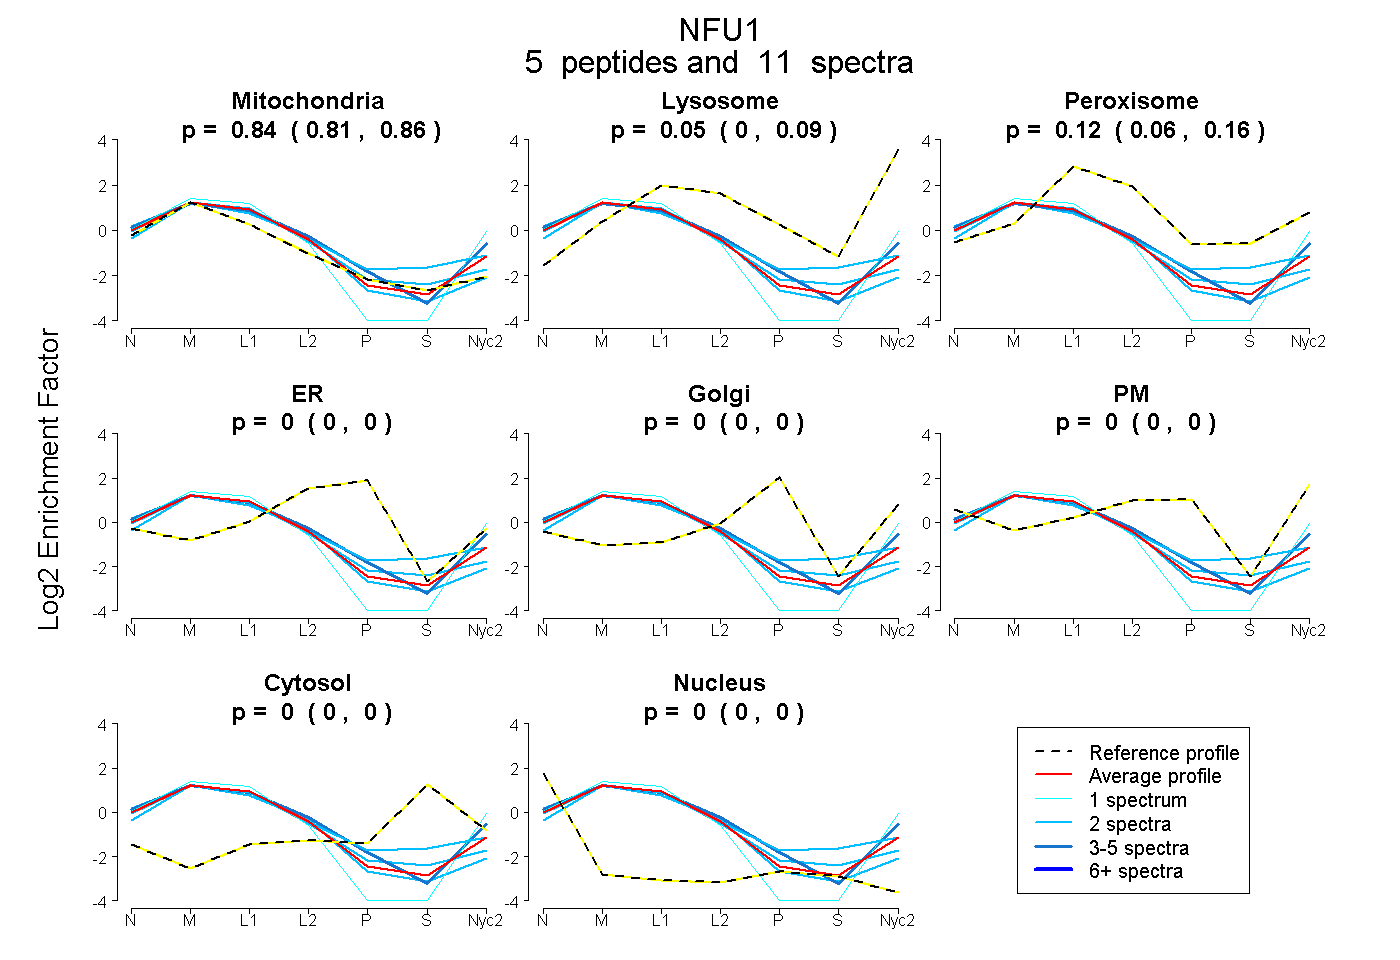
0.814 | 0.857
0.000 | 0.094
0.058 | 0.158
0.000 | 0.000
0.000 | 0.000
0.000 | 0.000
0.000 | 0.000
0.000 | 0.000
6peptides
spectra
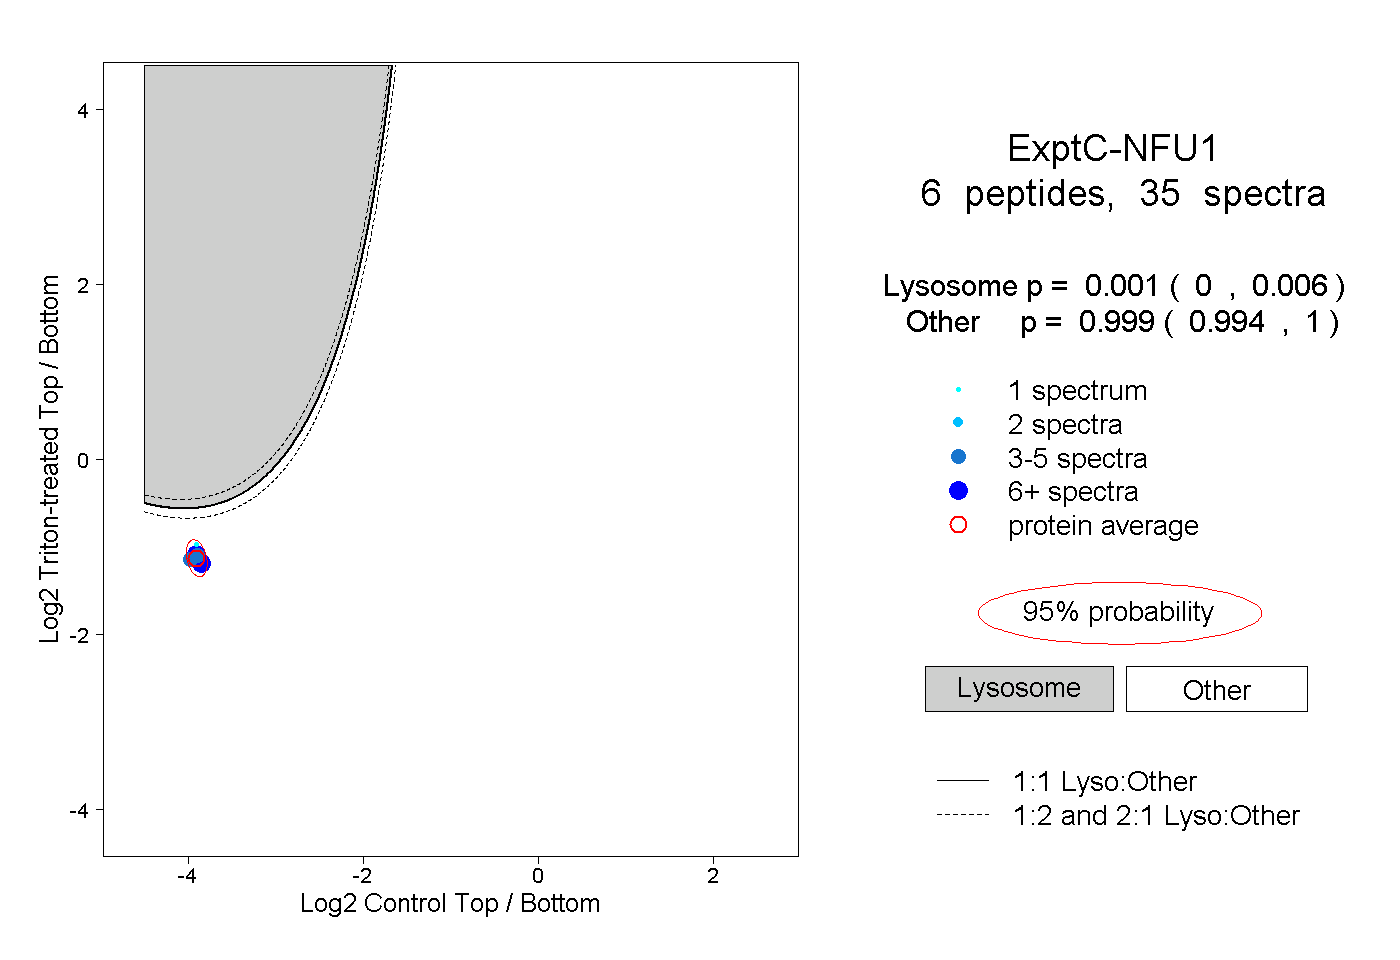
0.000 | 0.006
0.994 | 1.000
1peptide
spectrum
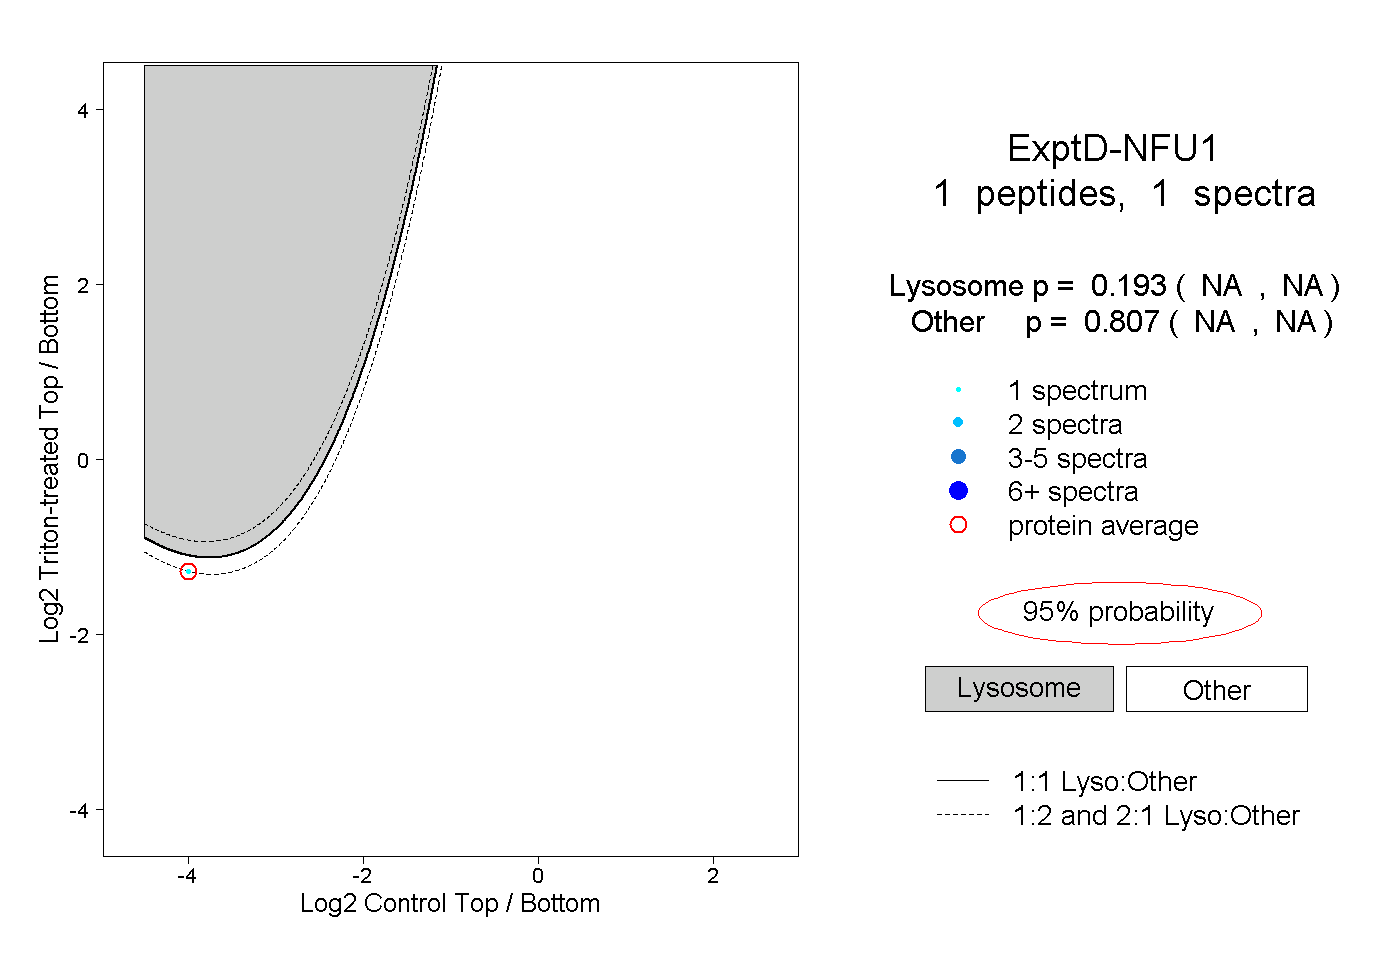
NA | NA
NA | NA