 5
5peptides
spectra
0.814 | 0.857
0.000 | 0.094
0.058 | 0.158
0.000 | 0.000
0.000 | 0.000
0.000 | 0.000
0.000 | 0.000
0.000 | 0.000
| Plot | Mito | Lyso | Perox | ER | Golgi | PM | Cytosol | Nucleus | |||||
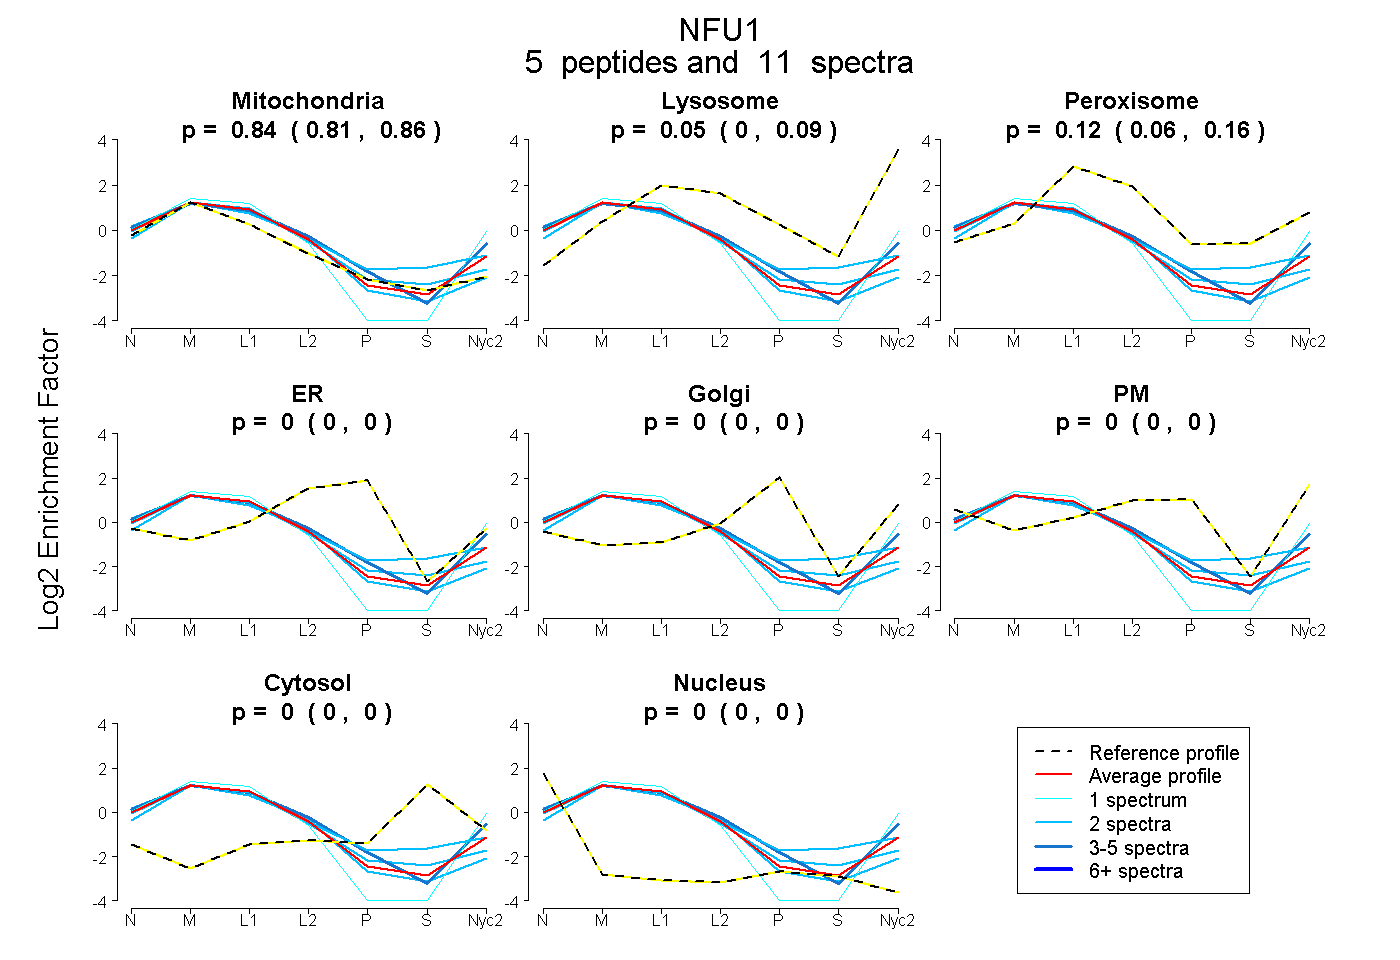
| Expt A |
5 peptides |
11 spectra |
|
0.838 0.814 | 0.857 |
0.047 0.000 | 0.094 |
0.116 0.058 | 0.158 |
0.000 0.000 | 0.000 |
0.000 0.000 | 0.000 |
0.000 0.000 | 0.000 |
0.000 0.000 | 0.000 |
0.000 0.000 | 0.000 |
| 1 spectrum, SVFFGPDFITVTK | 0.869 | 0.131 | 0.000 | 0.000 | 0.000 | 0.000 | 0.000 | 0.000 | ||
| 2 spectra, TMDFPTPAAAFR | 0.696 | 0.017 | 0.258 | 0.000 | 0.000 | 0.000 | 0.029 | 0.000 | ||
| 4 spectra, IRPTVQEDGGDVIYR | 0.743 | 0.119 | 0.000 | 0.000 | 0.000 | 0.138 | 0.000 | 0.000 | ||
| 2 spectra, GFEDGIVR | 0.851 | 0.000 | 0.149 | 0.000 | 0.000 | 0.000 | 0.000 | 0.000 | ||
| 2 spectra, FIPGKPVLETR | 0.953 | 0.000 | 0.047 | 0.000 | 0.000 | 0.000 | 0.000 | 0.000 |
| Plot | Lyso | Other | |||||||||||
| Expt C |
6 peptides |
35 spectra |
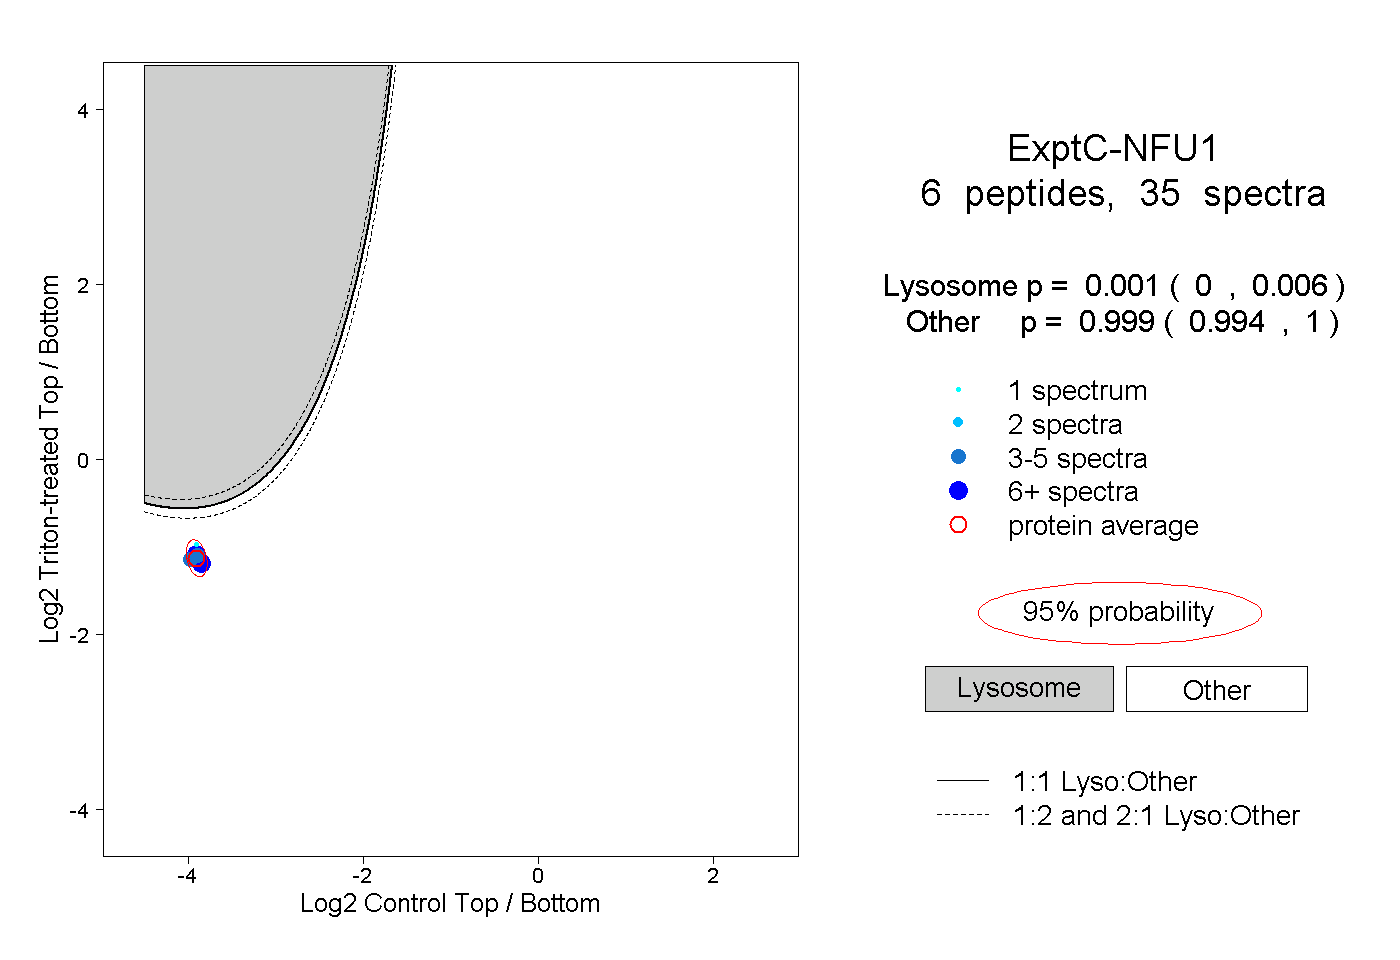 |
0.001 0.000 | 0.006 |
0.999 0.994 | 1.000 |
||||||||
| Plot | Lyso | Other | |||||||||||
| Expt D |
1 peptide |
1 spectrum |
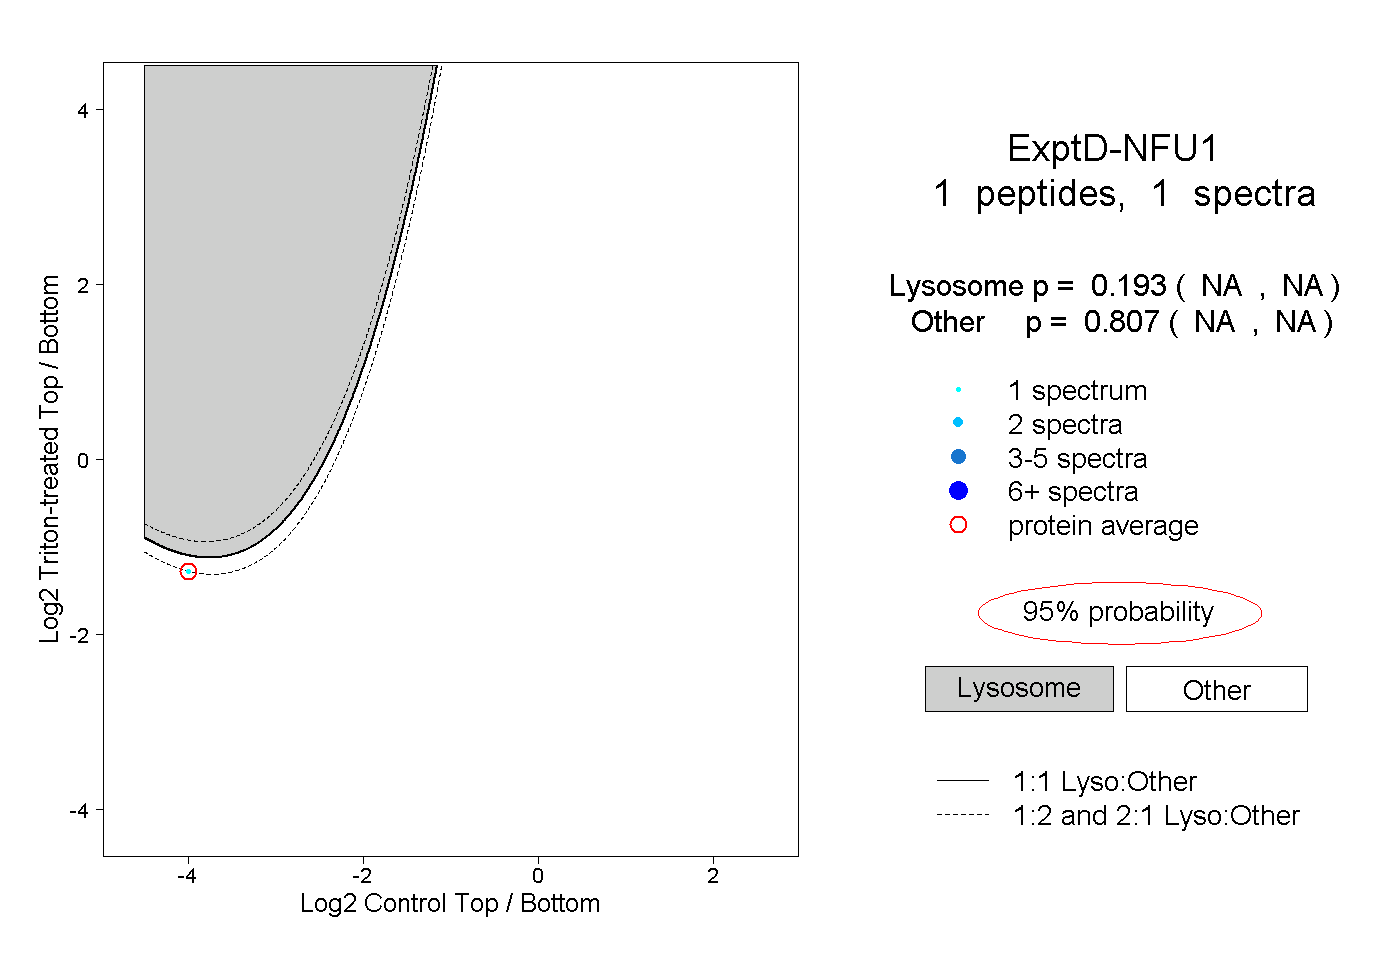 |
0.193 NA | NA |
0.807 NA | NA |