 4
4peptides
spectra
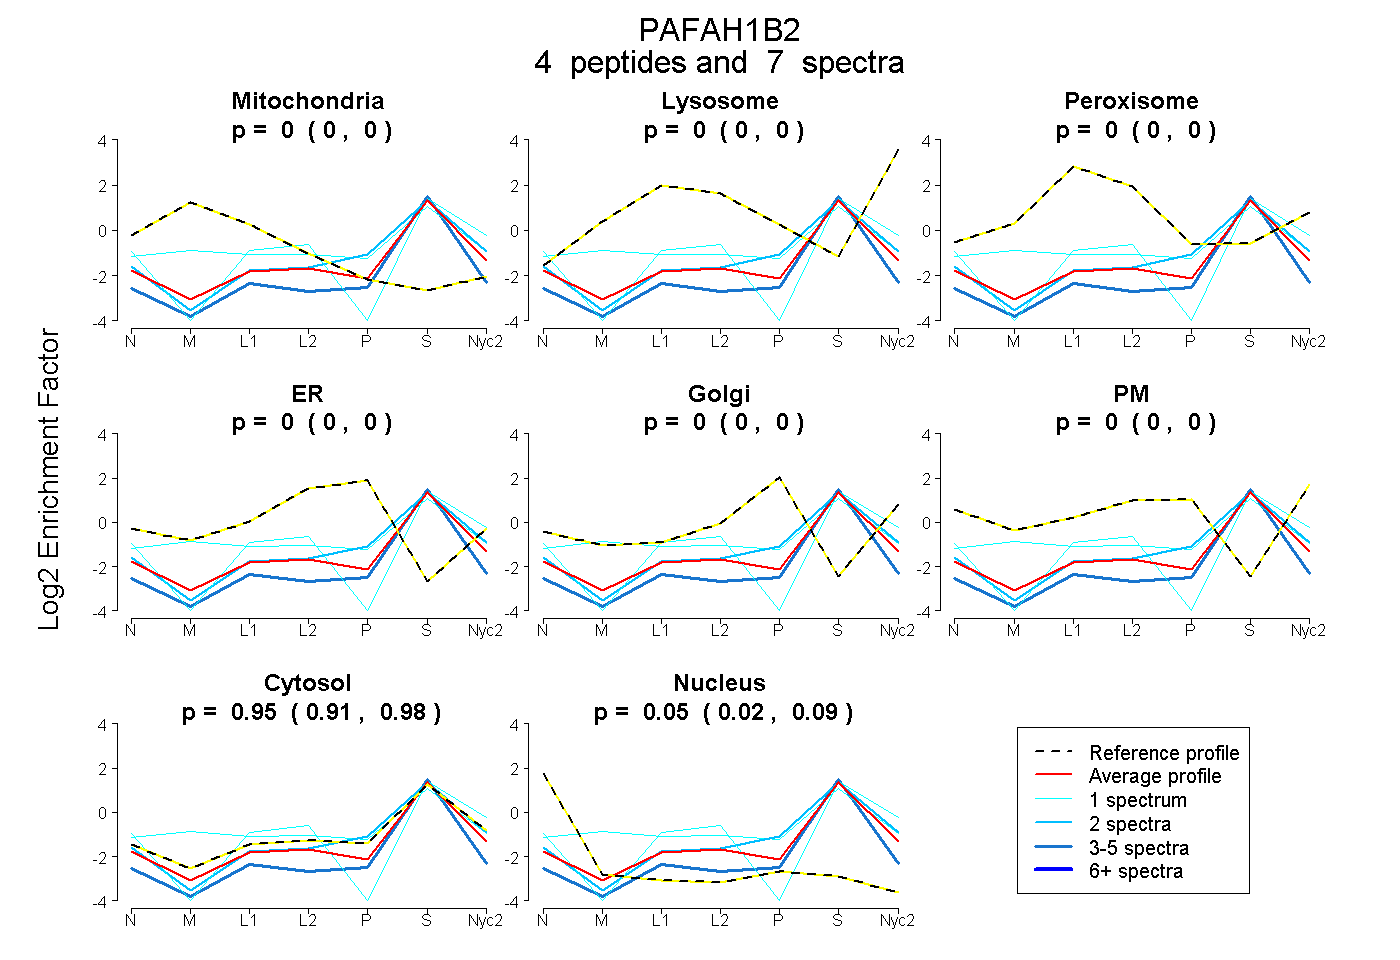
0.000 | 0.000
0.000 | 0.000
0.000 | 0.000
0.000 | 0.000
0.000 | 0.000
0.000 | 0.000
0.906 | 0.979
0.016 | 0.088
3peptides
spectra
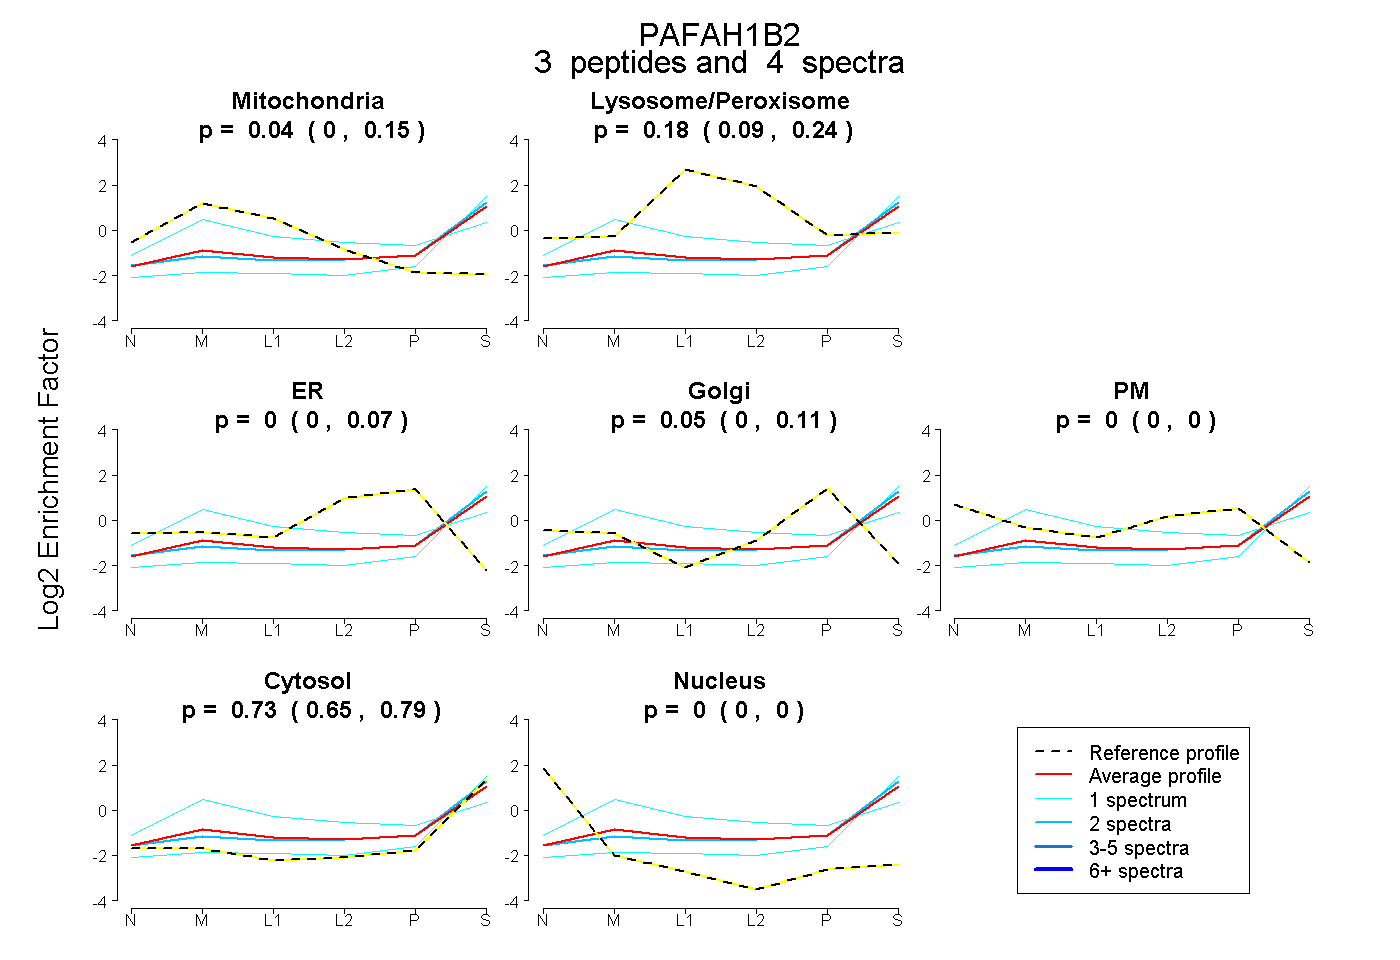
0.000 | 0.150
0.094 | 0.237
0.000 | 0.072
0.000 | 0.106
0.000 | 0.000
0.647 | 0.792
0.000 | 0.000
3peptides
spectra
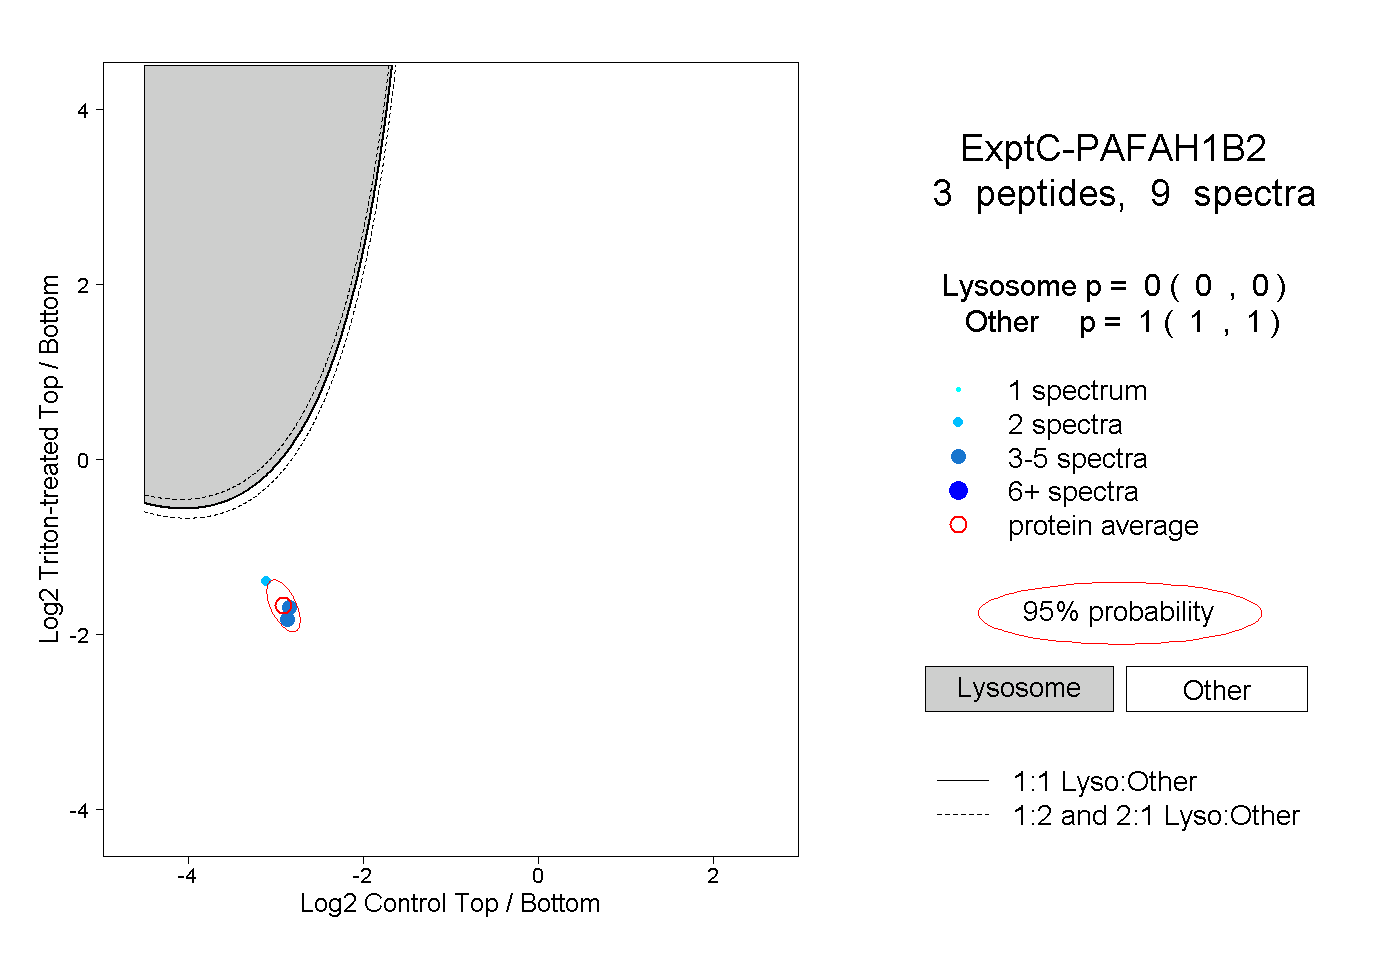
0.000 | 0.000
1.000 | 1.000
1peptide
spectrum
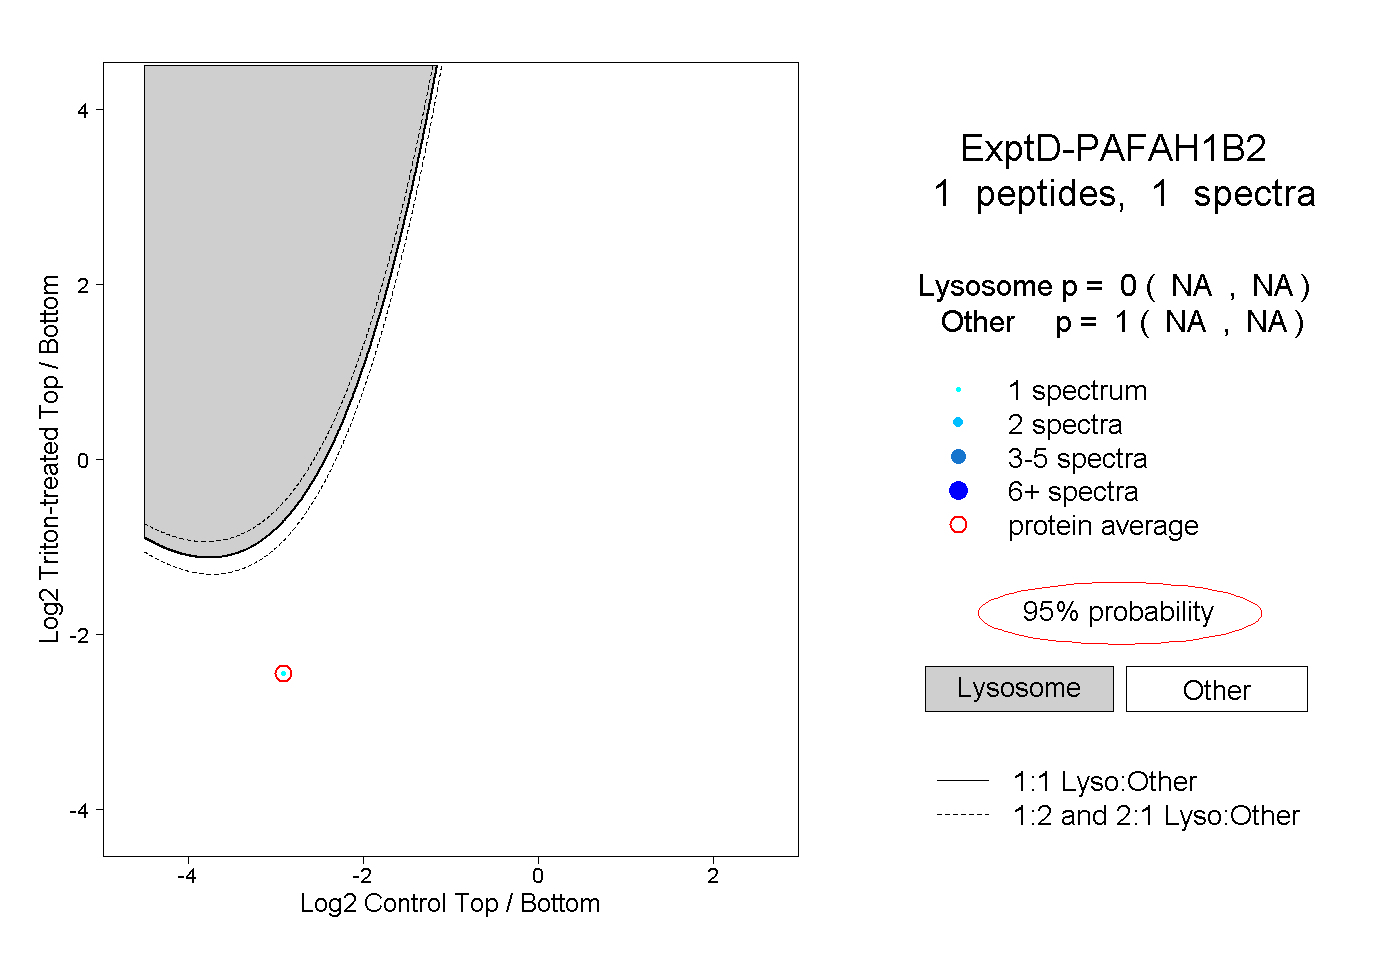
NA | NA
NA | NA