 4
4peptides
spectra
0.000 | 0.000
0.000 | 0.000
0.000 | 0.000
0.000 | 0.000
0.000 | 0.000
0.000 | 0.000
0.906 | 0.979
0.016 | 0.088
| Plot | Mito | Lyso | Perox | ER | Golgi | PM | Cytosol | Nucleus | |||||
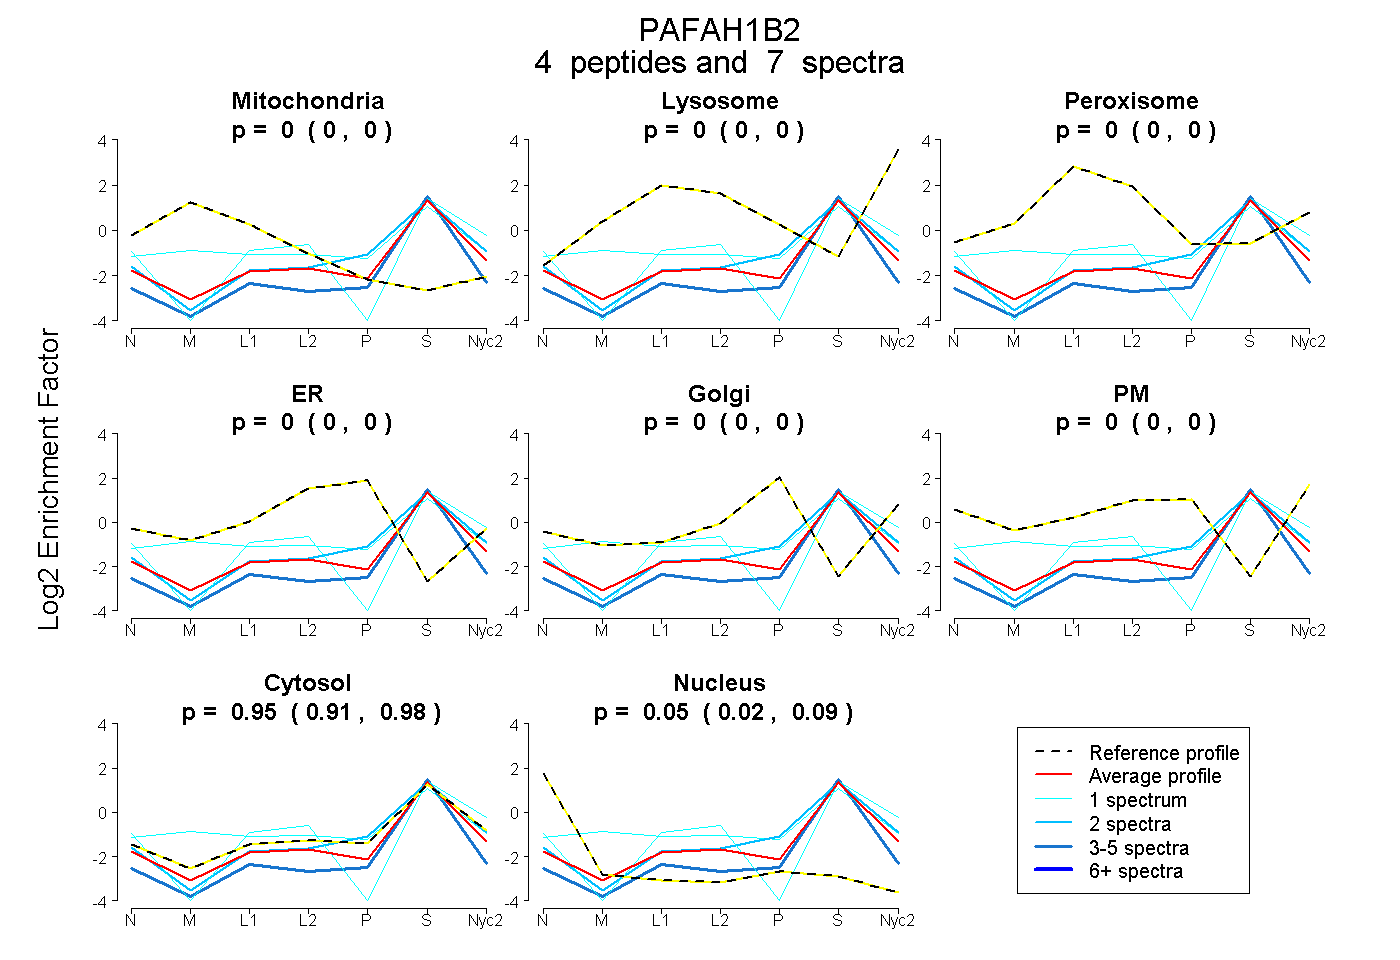
| Expt A |
4 peptides |
7 spectra |
|
0.000 0.000 | 0.000 |
0.000 0.000 | 0.000 |
0.000 0.000 | 0.000 |
0.000 0.000 | 0.000 |
0.000 0.000 | 0.000 |
0.000 0.000 | 0.000 |
0.945 0.906 | 0.979 |
0.055 0.016 | 0.088 |
| 2 spectra, GEKPNPLR | 0.000 | 0.000 | 0.000 | 0.000 | 0.000 | 0.000 | 0.991 | 0.009 | ||
| 3 spectra, ELFSPLHALNFGIGGDTTR | 0.000 | 0.000 | 0.000 | 0.000 | 0.000 | 0.000 | 0.873 | 0.127 | ||
| 1 spectrum, SQGDSNPAAIPHAAEDIQGDDR | 0.000 | 0.000 | 0.000 | 0.000 | 0.000 | 0.000 | 0.983 | 0.017 | ||
| 1 spectrum, FVLDCK | 0.177 | 0.010 | 0.062 | 0.000 | 0.000 | 0.000 | 0.752 | 0.000 |
| Plot | Mito | Lyso or Perox | ER | Golgi | PM | Cytosol | Nucleus | ||||||
| Expt B |
3 peptides |
4 spectra |
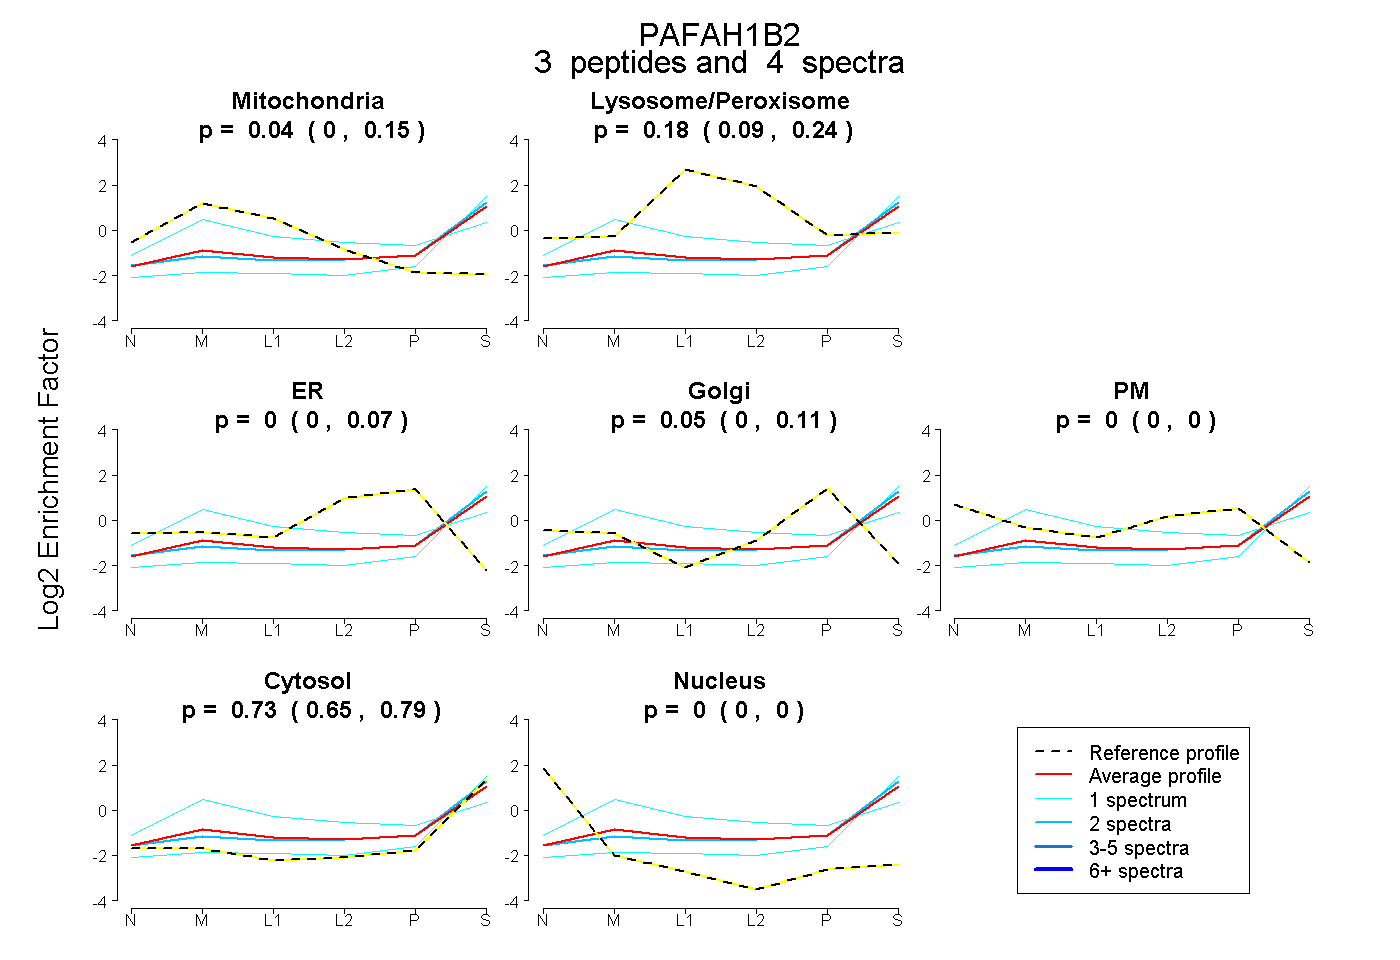 |
0.037 0.000 | 0.150 |
0.184 0.094 | 0.237 |
0.000 0.000 | 0.072 |
0.048 0.000 | 0.106 |
0.000 0.000 | 0.000 |
0.732 0.647 | 0.792 |
0.000 0.000 | 0.000 |
|||
| Plot | Lyso | Other | |||||||||||
| Expt C |
3 peptides |
9 spectra |
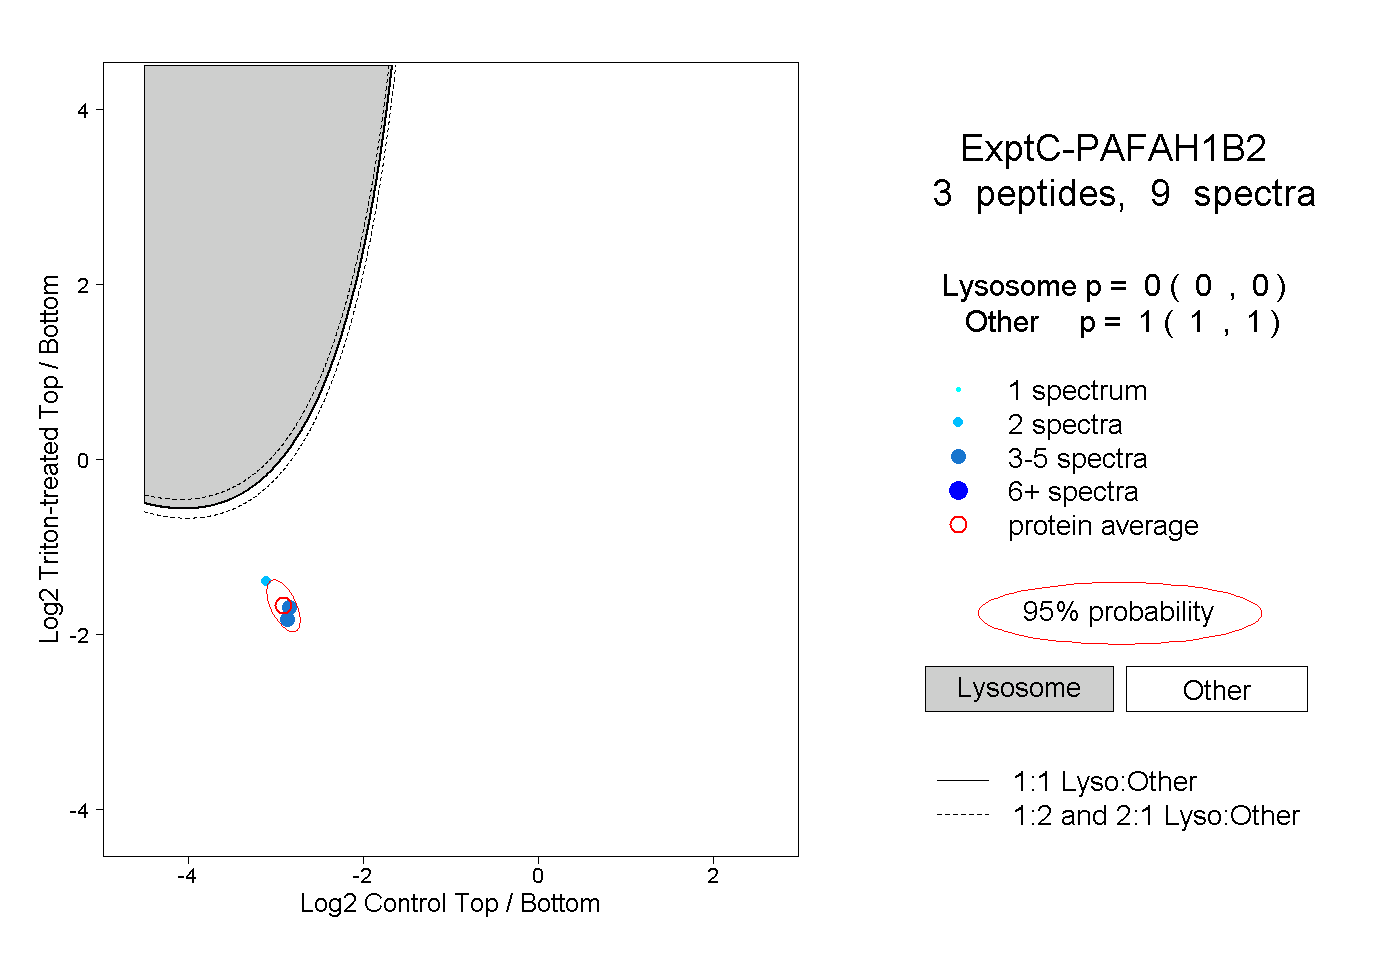 |
0.000 0.000 | 0.000 |
1.000 1.000 | 1.000 |
||||||||
| Plot | Lyso | Other | |||||||||||
| Expt D |
1 peptide |
1 spectrum |
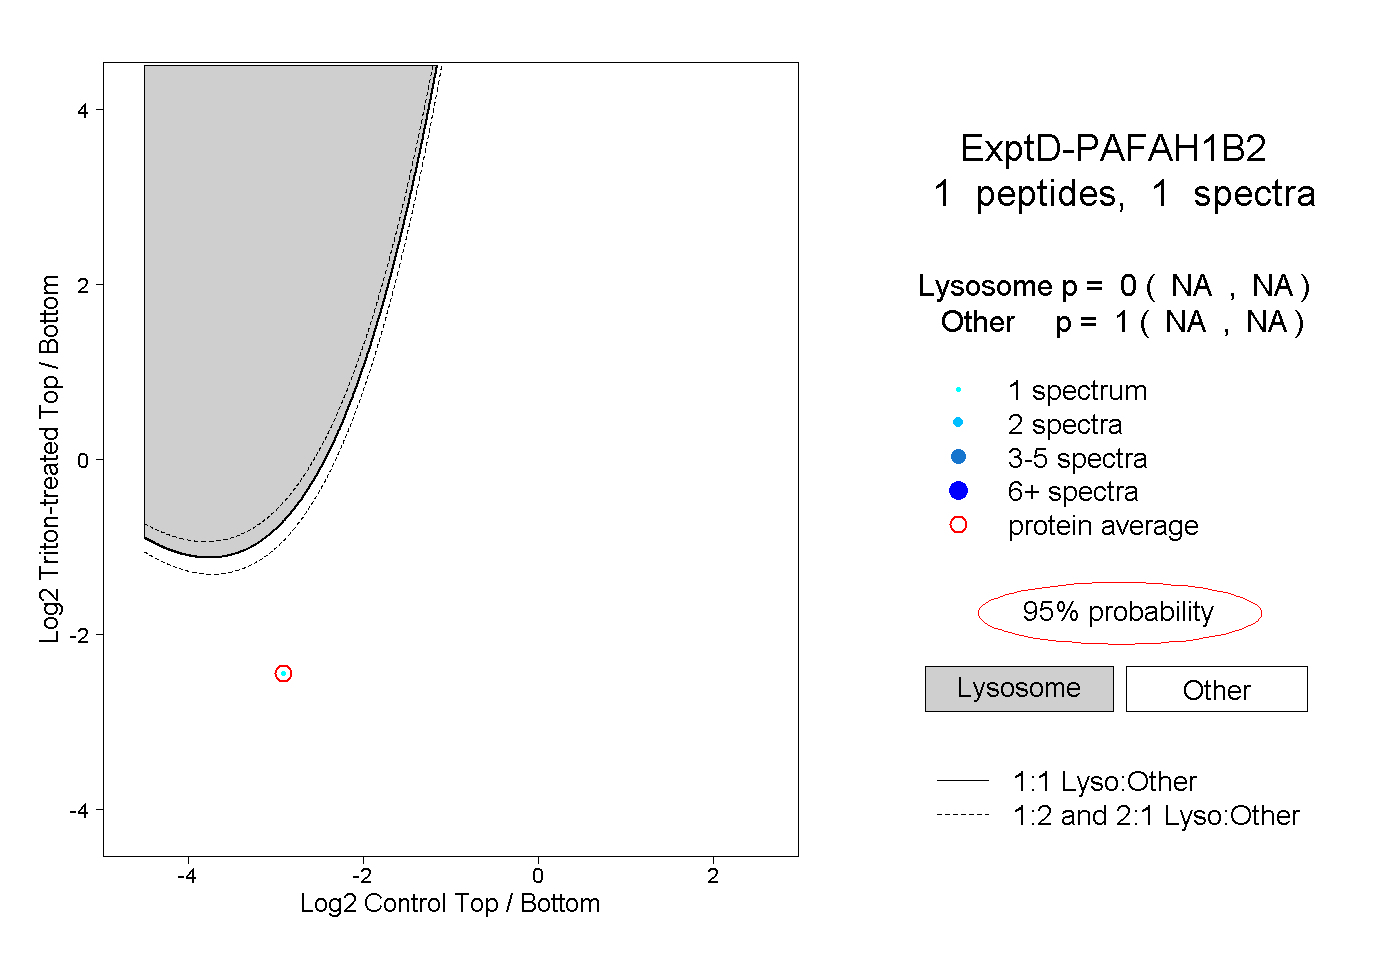 |
0.000 NA | NA |
1.000 NA | NA |