 7
7peptides
spectra
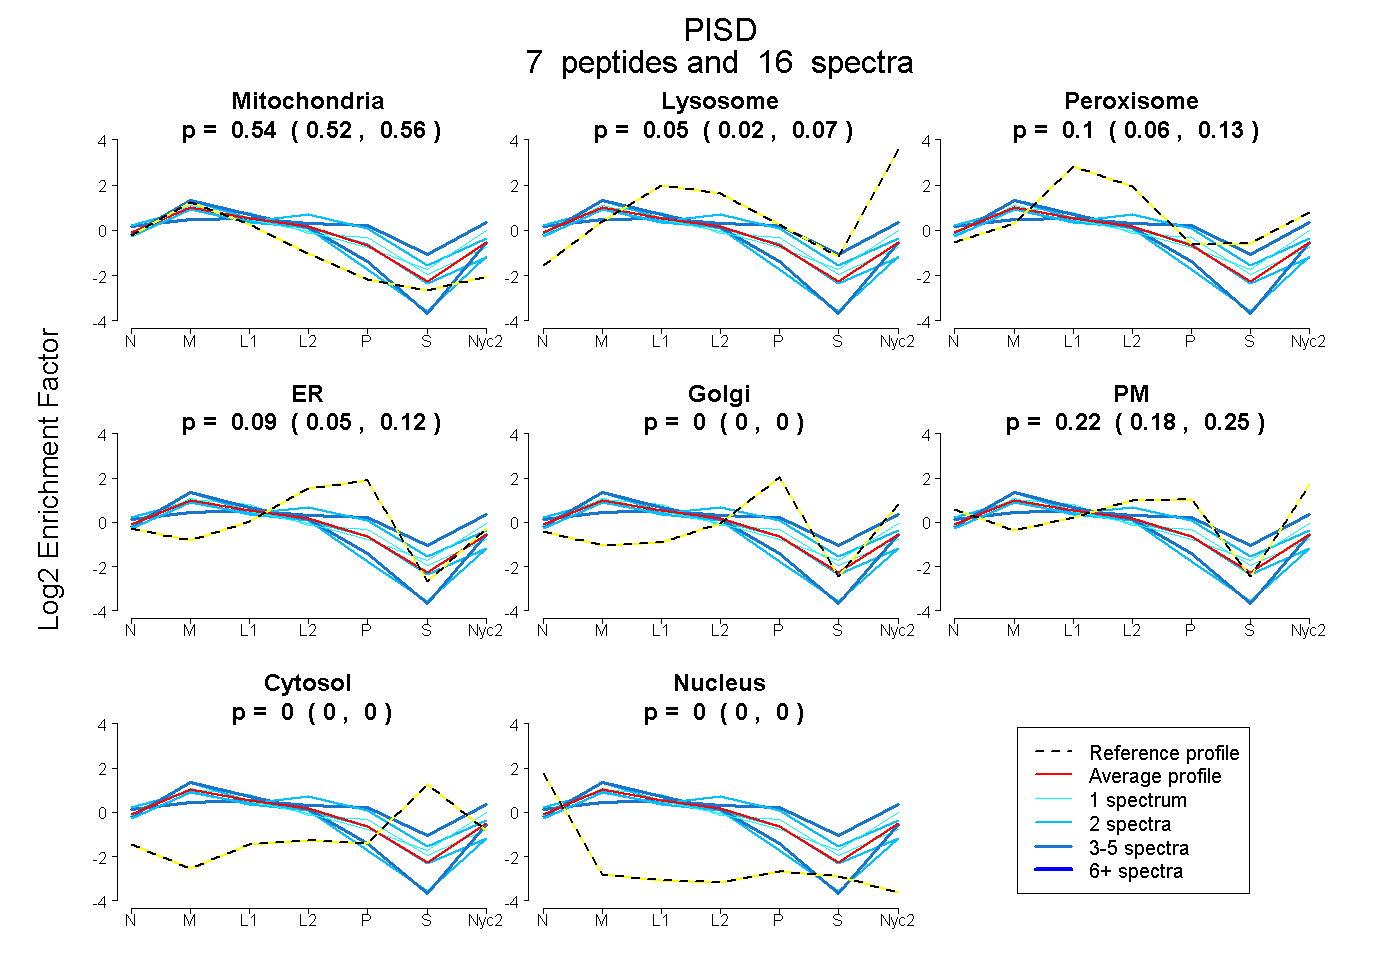
0.520 | 0.559
0.022 | 0.074
0.061 | 0.134
0.050 | 0.124
0.000 | 0.000
0.185 | 0.246
0.000 | 0.000
0.000 | 0.000
3peptides
spectra
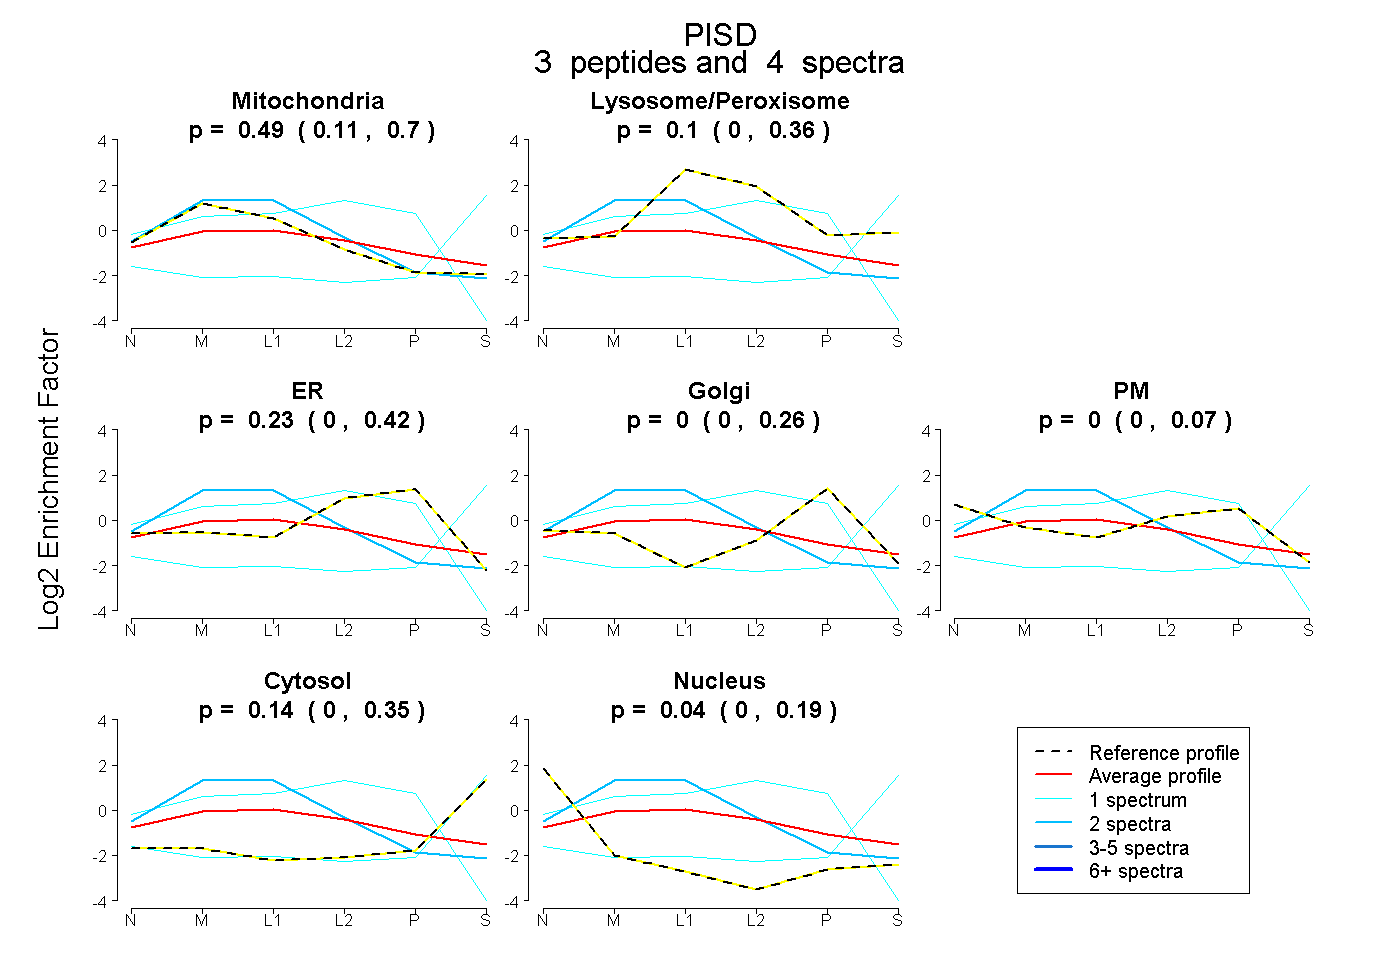
0.107 | 0.696
0.000 | 0.361
0.000 | 0.415
0.000 | 0.256
0.000 | 0.069
0.000 | 0.350
0.000 | 0.190
12peptides
spectra
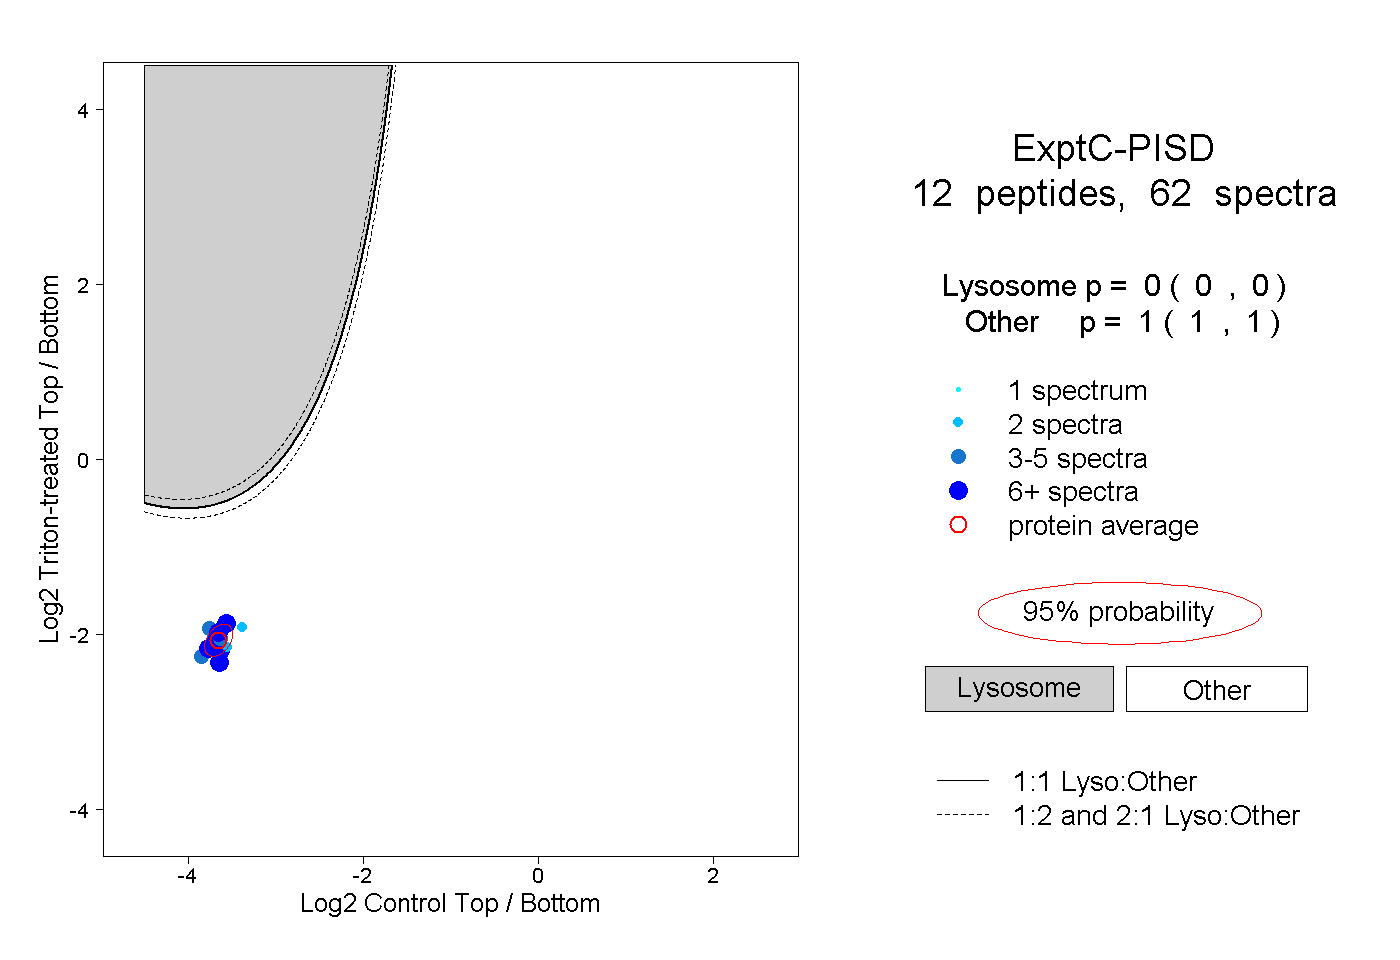
0.000 | 0.000
1.000 | 1.000
1peptide
spectrum
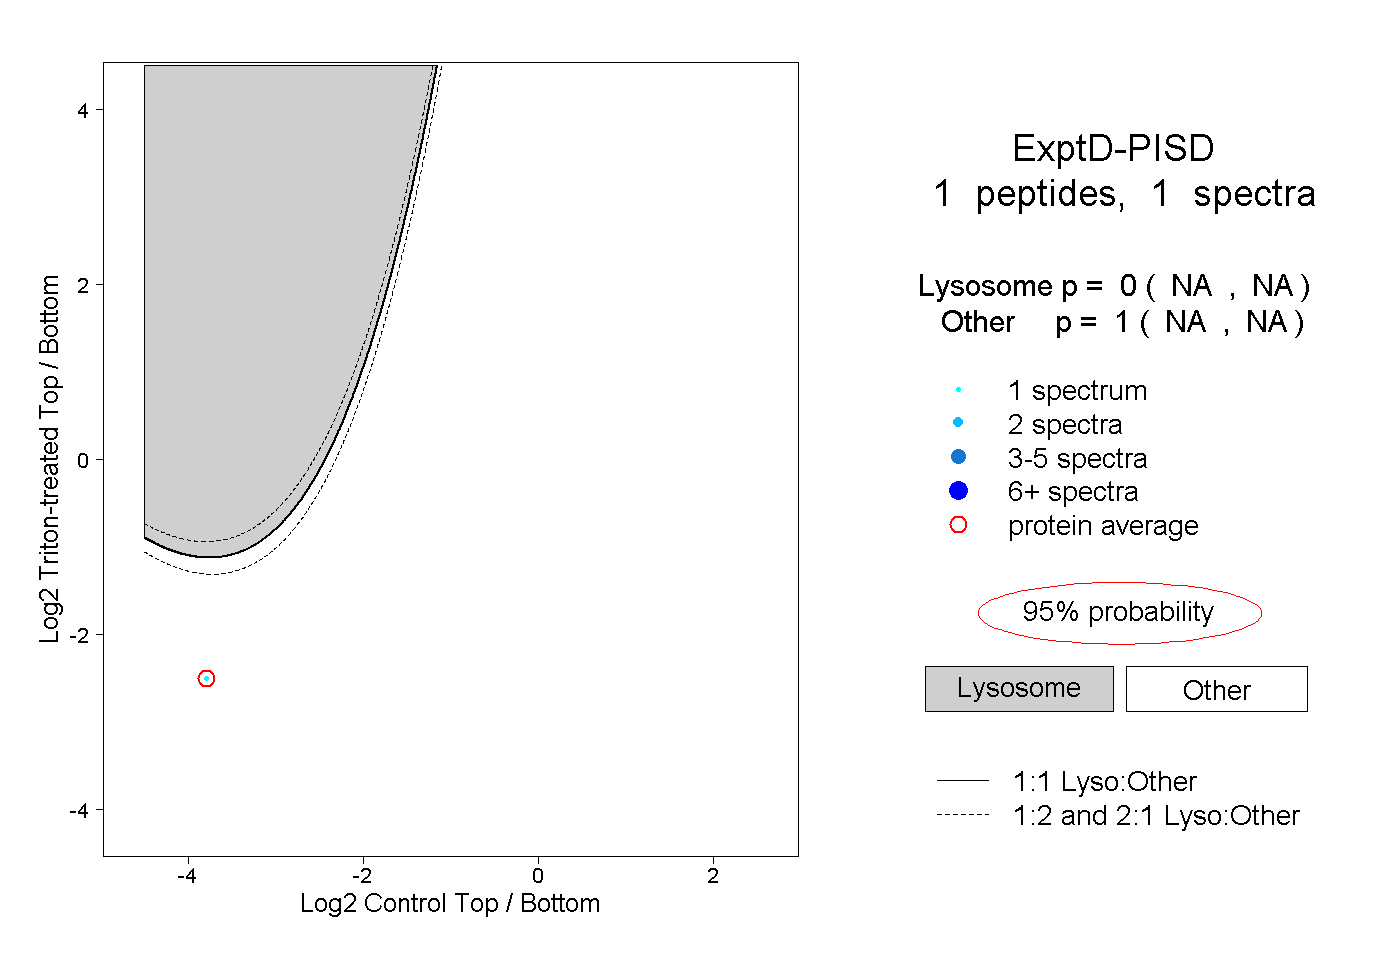
NA | NA
NA | NA