 7
7peptides
spectra
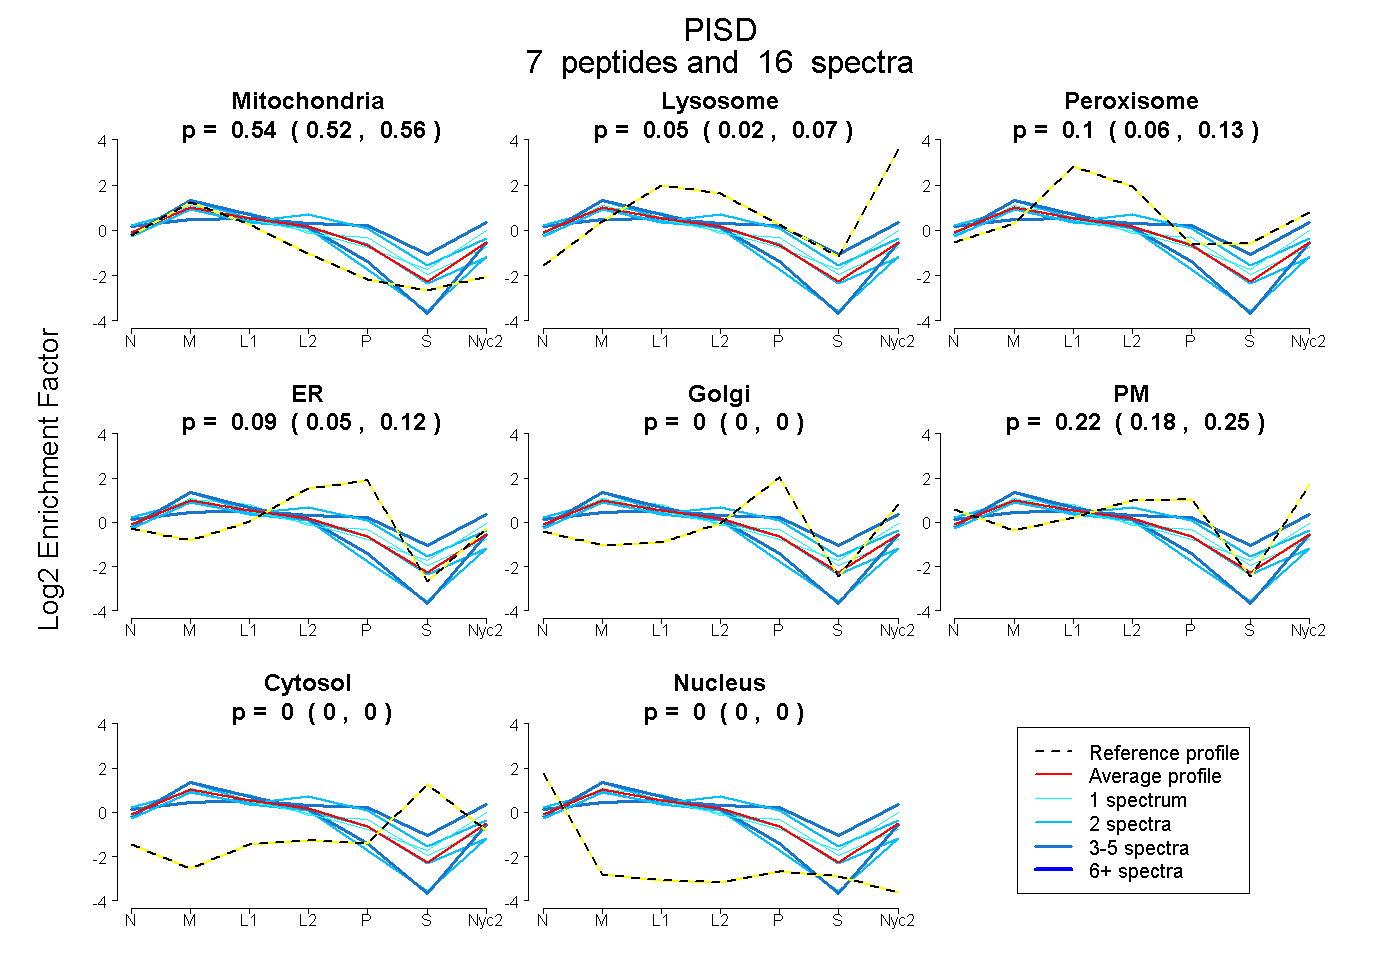
0.520 | 0.559
0.022 | 0.074
0.061 | 0.134
0.050 | 0.124
0.000 | 0.000
0.185 | 0.246
0.000 | 0.000
0.000 | 0.000
| Plot | Mito | Lyso | Perox | ER | Golgi | PM | Cytosol | Nucleus | |||||
| Expt A |
7 peptides |
16 spectra |
|
0.541 0.520 | 0.559 |
0.051 0.022 | 0.074 |
0.101 0.061 | 0.134 |
0.090 0.050 | 0.124 |
0.000 0.000 | 0.000 |
0.217 0.185 | 0.246 |
0.000 0.000 | 0.000 |
0.000 0.000 | 0.000 |
| 1 spectrum, VVLTGDWK | 0.534 | 0.191 | 0.044 | 0.000 | 0.000 | 0.205 | 0.026 | 0.000 | ||
| 2 spectra, LASHWEVSLYK | 0.598 | 0.000 | 0.068 | 0.222 | 0.000 | 0.112 | 0.000 | 0.000 | ||
| 2 spectra, LNQVELPSWLR | 0.792 | 0.043 | 0.000 | 0.031 | 0.000 | 0.134 | 0.000 | 0.000 | ||
| 1 spectrum, EGIPMR | 0.504 | 0.000 | 0.242 | 0.053 | 0.179 | 0.022 | 0.000 | 0.000 | ||
| 4 spectra, HFPGSLMSVNPGMAR | 0.192 | 0.000 | 0.279 | 0.000 | 0.127 | 0.309 | 0.092 | 0.000 | ||
| 2 spectra, VHTAPLR | 0.347 | 0.045 | 0.252 | 0.224 | 0.132 | 0.000 | 0.000 | 0.000 | ||
| 4 spectra, NLSEFFR | 0.691 | 0.096 | 0.000 | 0.000 | 0.000 | 0.213 | 0.000 | 0.000 |
| Plot | Mito | Lyso or Perox | ER | Golgi | PM | Cytosol | Nucleus | ||||||
| Expt B |
3 peptides |
4 spectra |
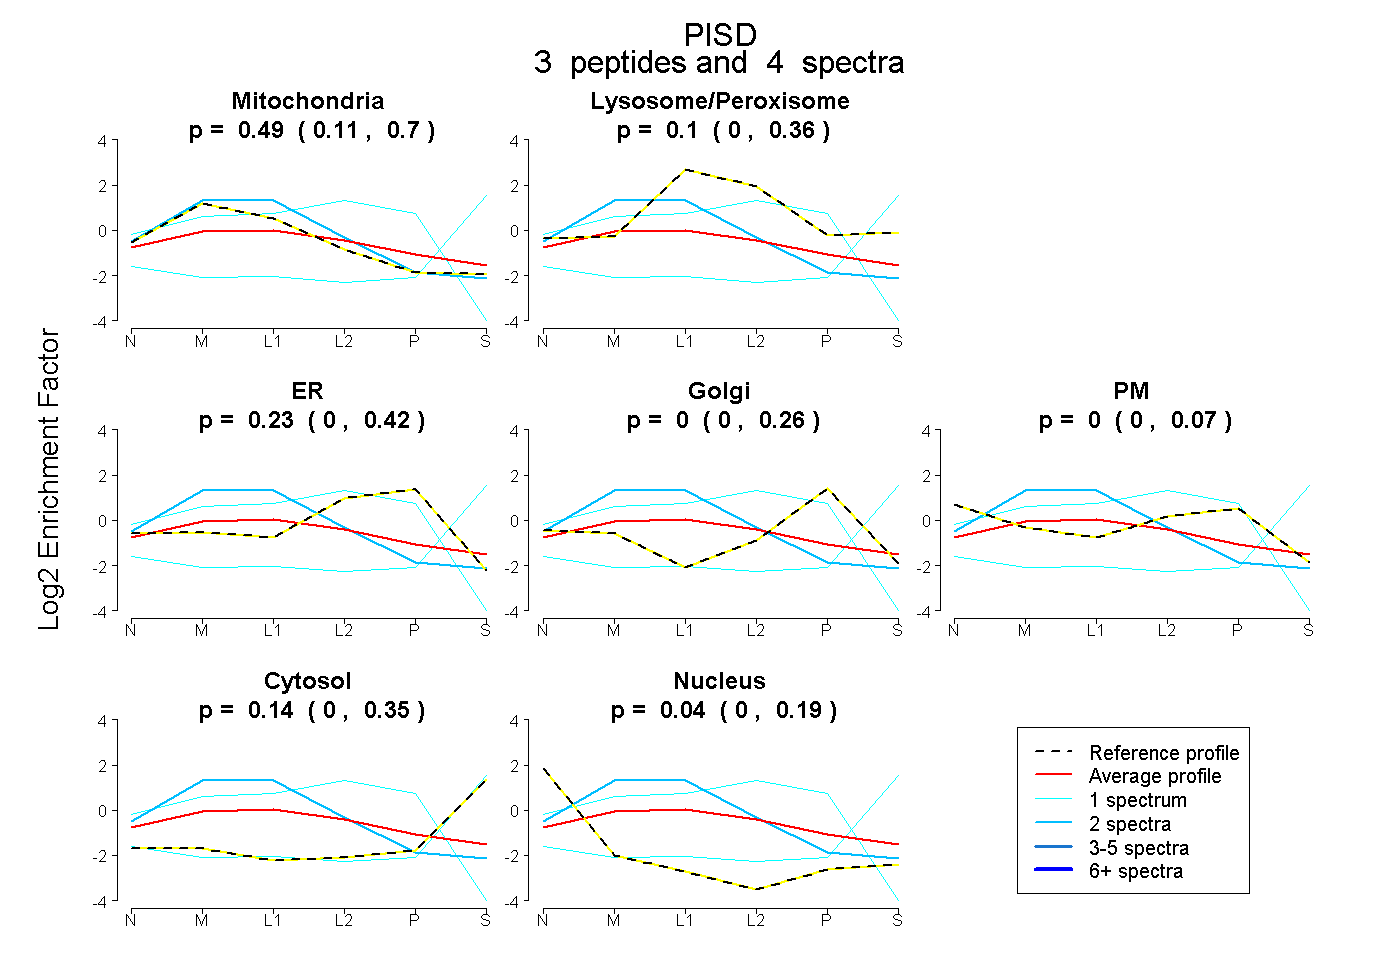 |
0.492 0.107 | 0.696 |
0.100 0.000 | 0.361 |
0.227 0.000 | 0.415 |
0.000 0.000 | 0.256 |
0.000 0.000 | 0.069 |
0.137 0.000 | 0.350 |
0.044 0.000 | 0.190 |
|||
| Plot | Lyso | Other | |||||||||||
| Expt C |
12 peptides |
62 spectra |
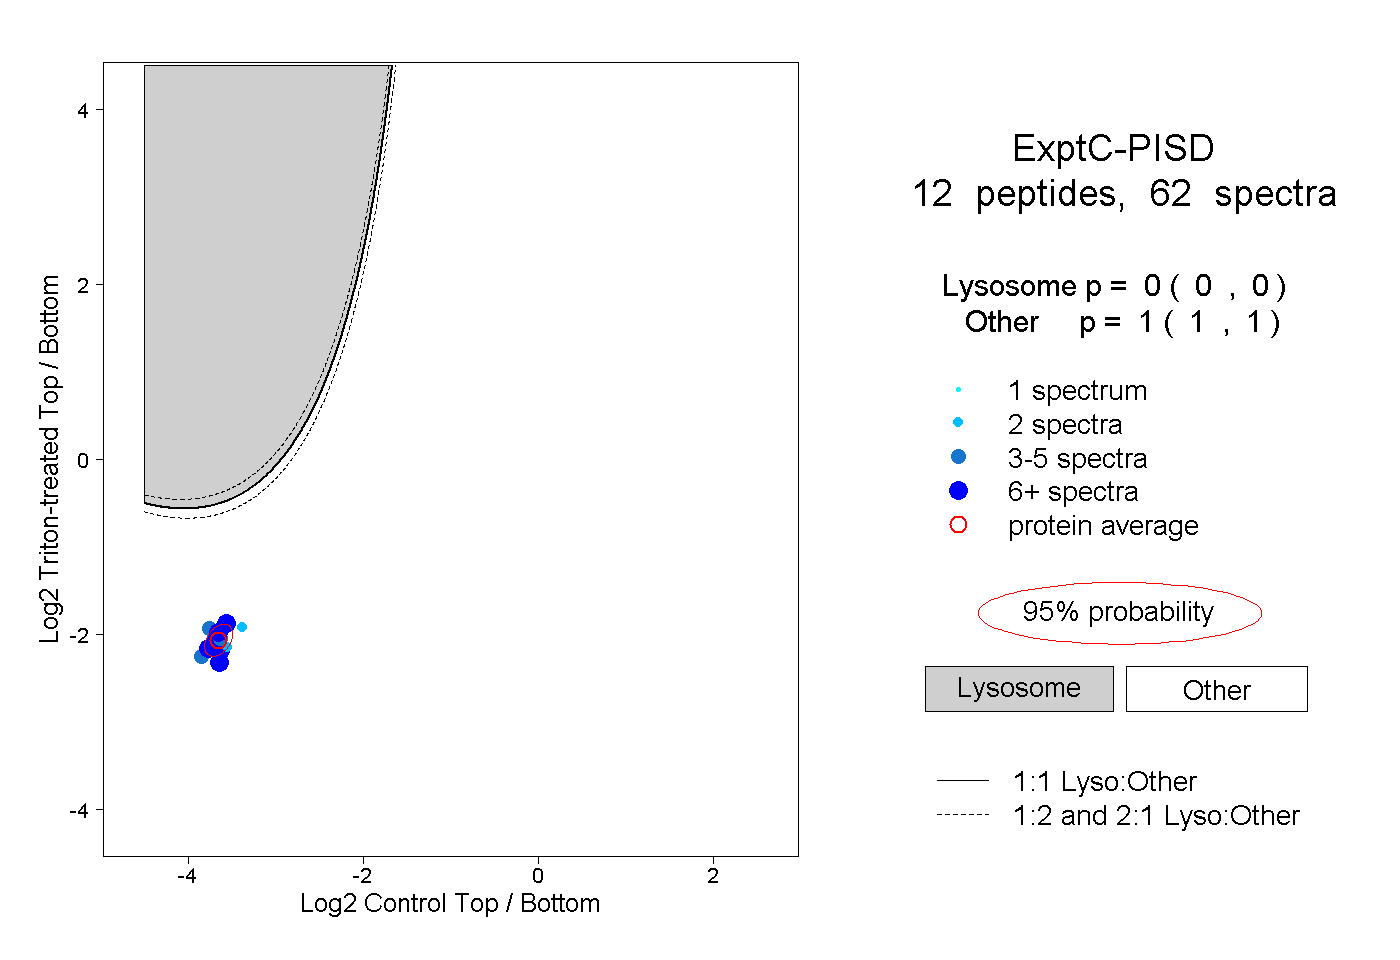 |
0.000 0.000 | 0.000 |
1.000 1.000 | 1.000 |
||||||||
| Plot | Lyso | Other | |||||||||||
| Expt D |
1 peptide |
1 spectrum |
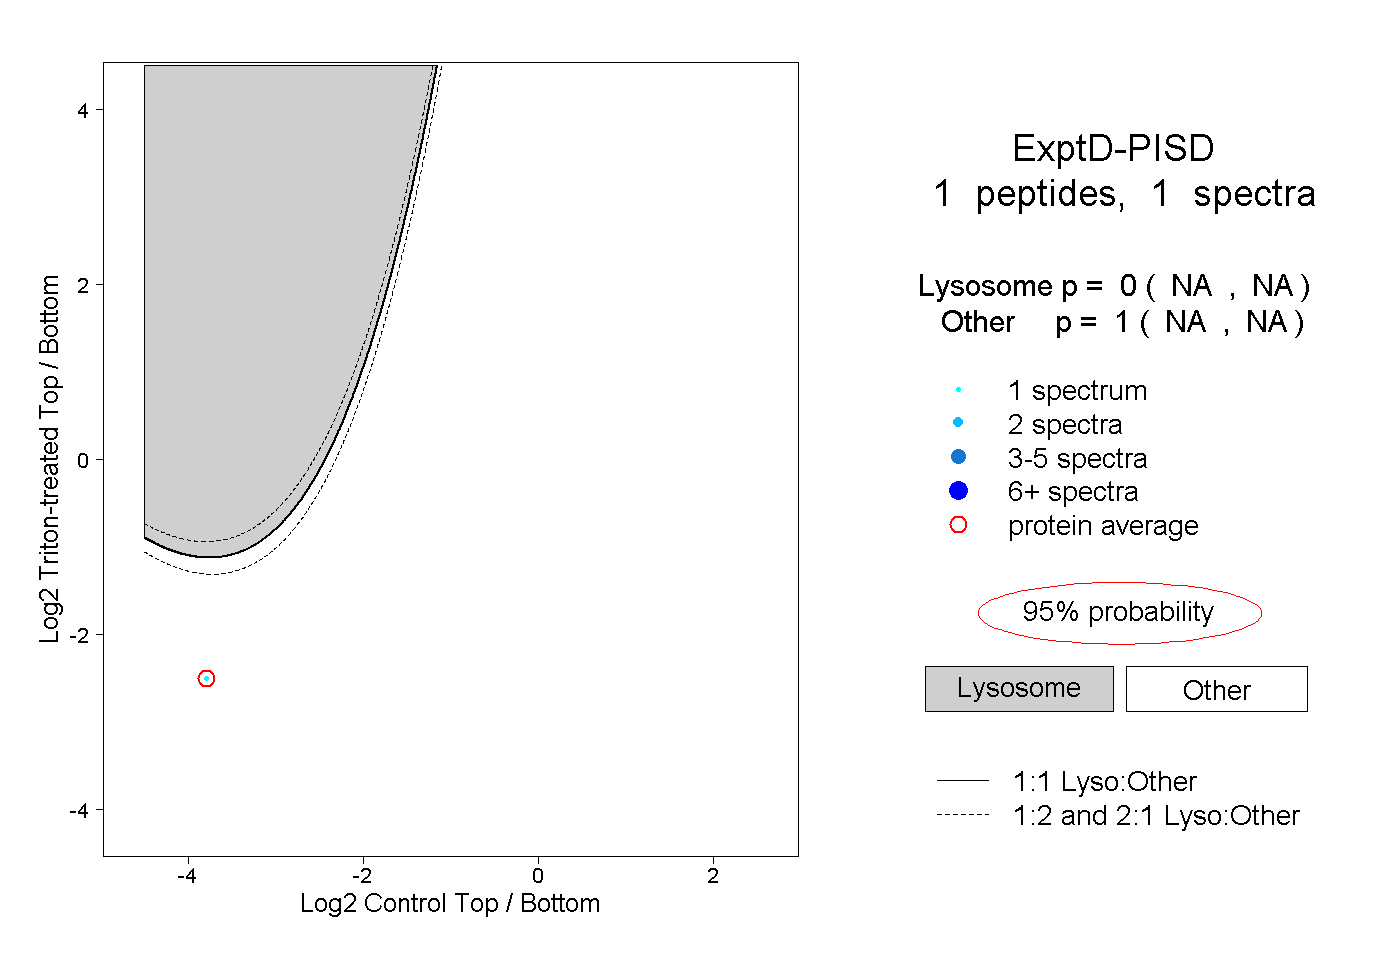 |
0.000 NA | NA |
1.000 NA | NA |