 12
12peptides
spectra
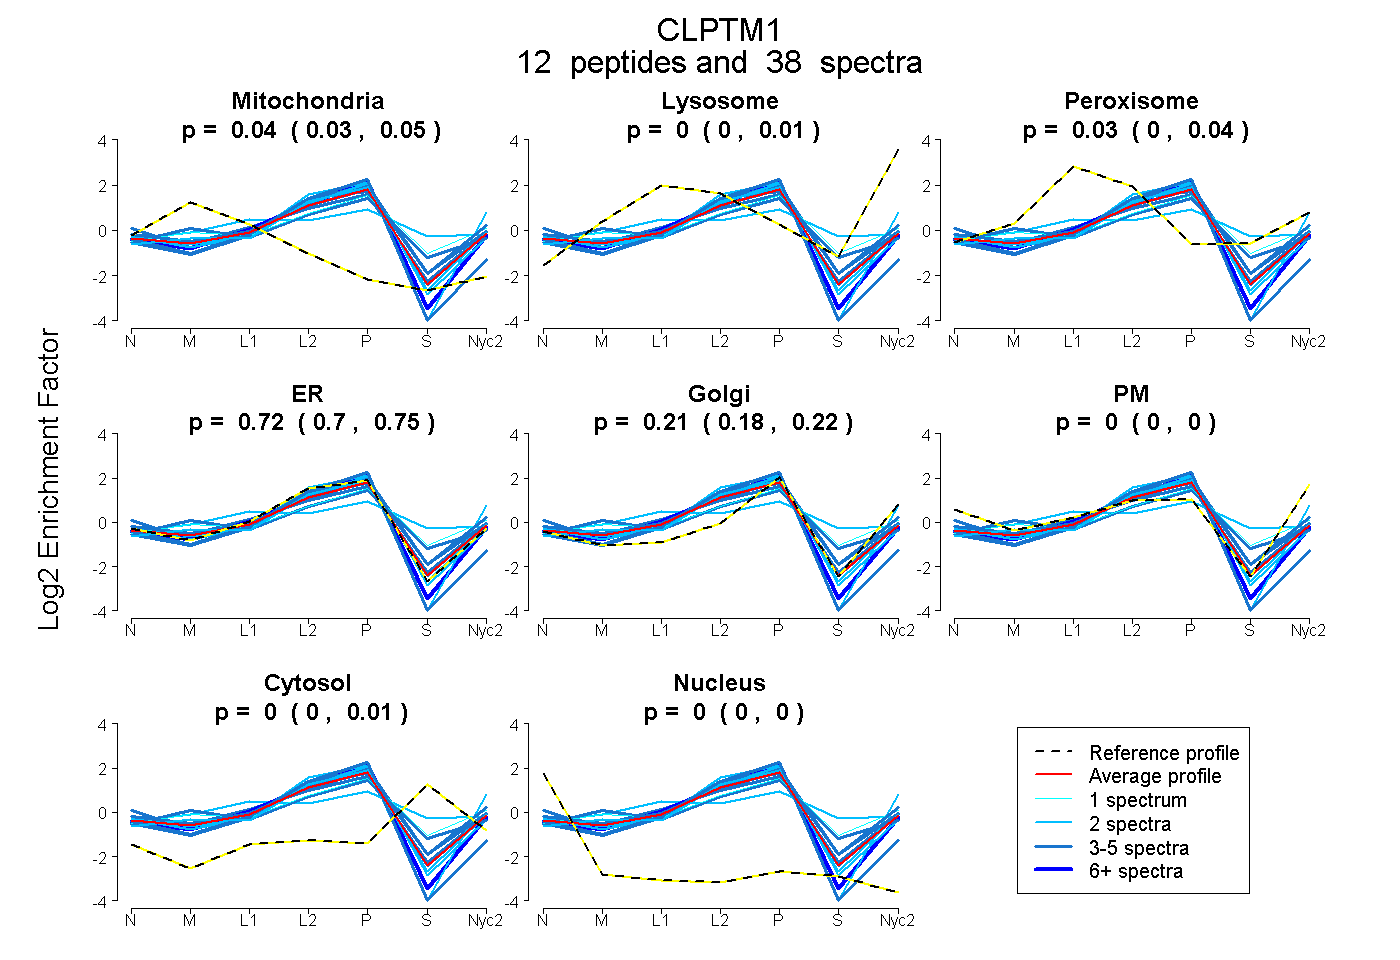
0.028 | 0.050
0.000 | 0.012
0.000 | 0.038
0.699 | 0.746
0.183 | 0.223
0.000 | 0.000
0.000 | 0.015
0.000 | 0.000
4peptides
spectra
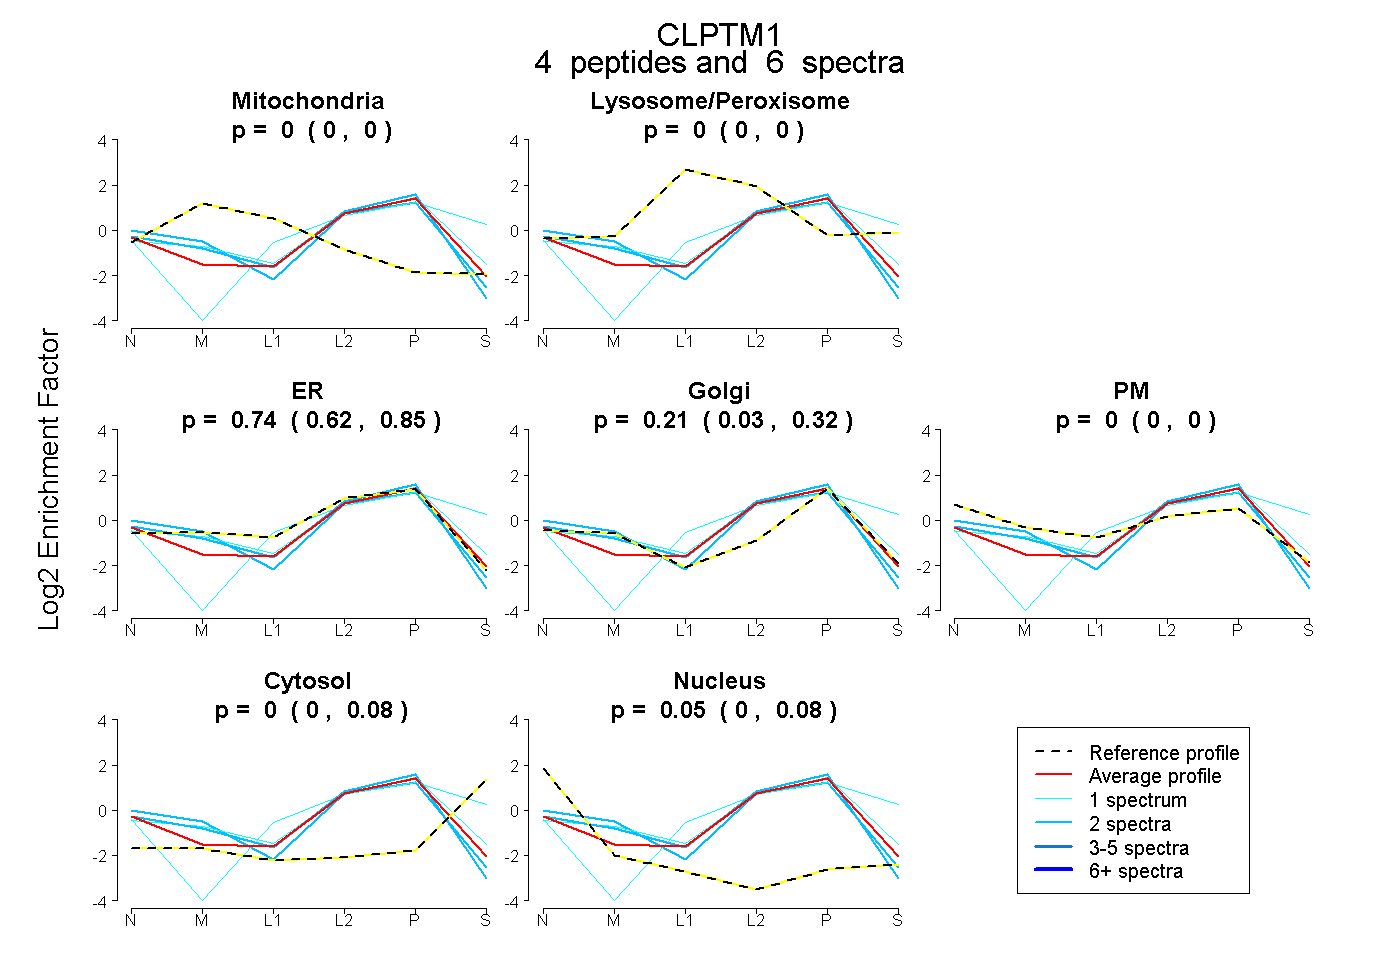
0.000 | 0.000
0.000 | 0.000
0.622 | 0.854
0.035 | 0.321
0.000 | 0.000
0.000 | 0.082
0.000 | 0.082
8peptides
spectra

0.000 | 0.000
1.000 | 1.000
4peptides
spectra
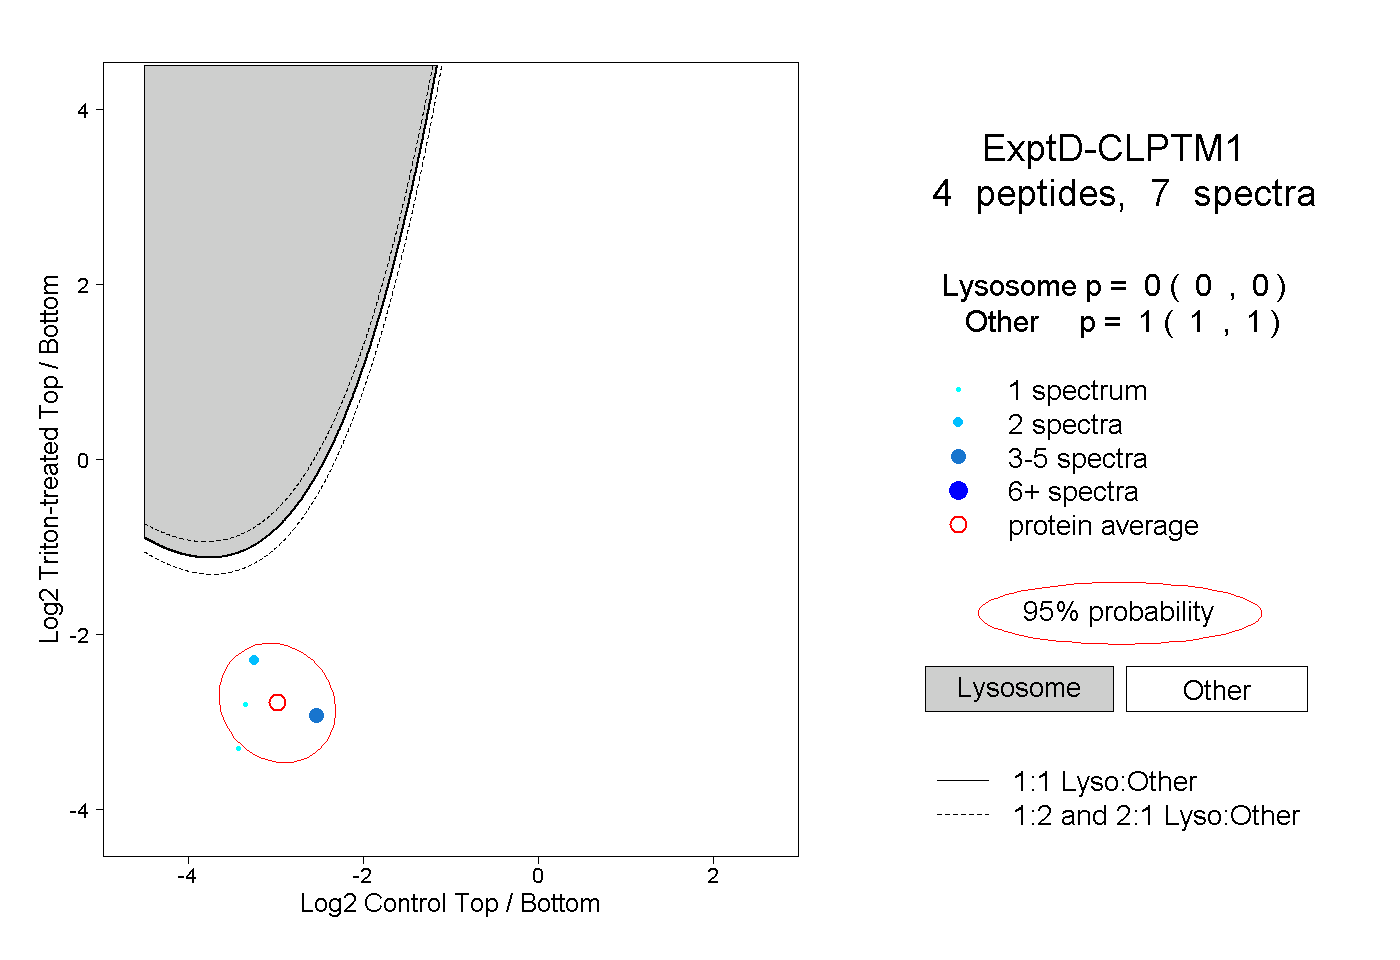
0.000 | 0.000
1.000 | 1.000