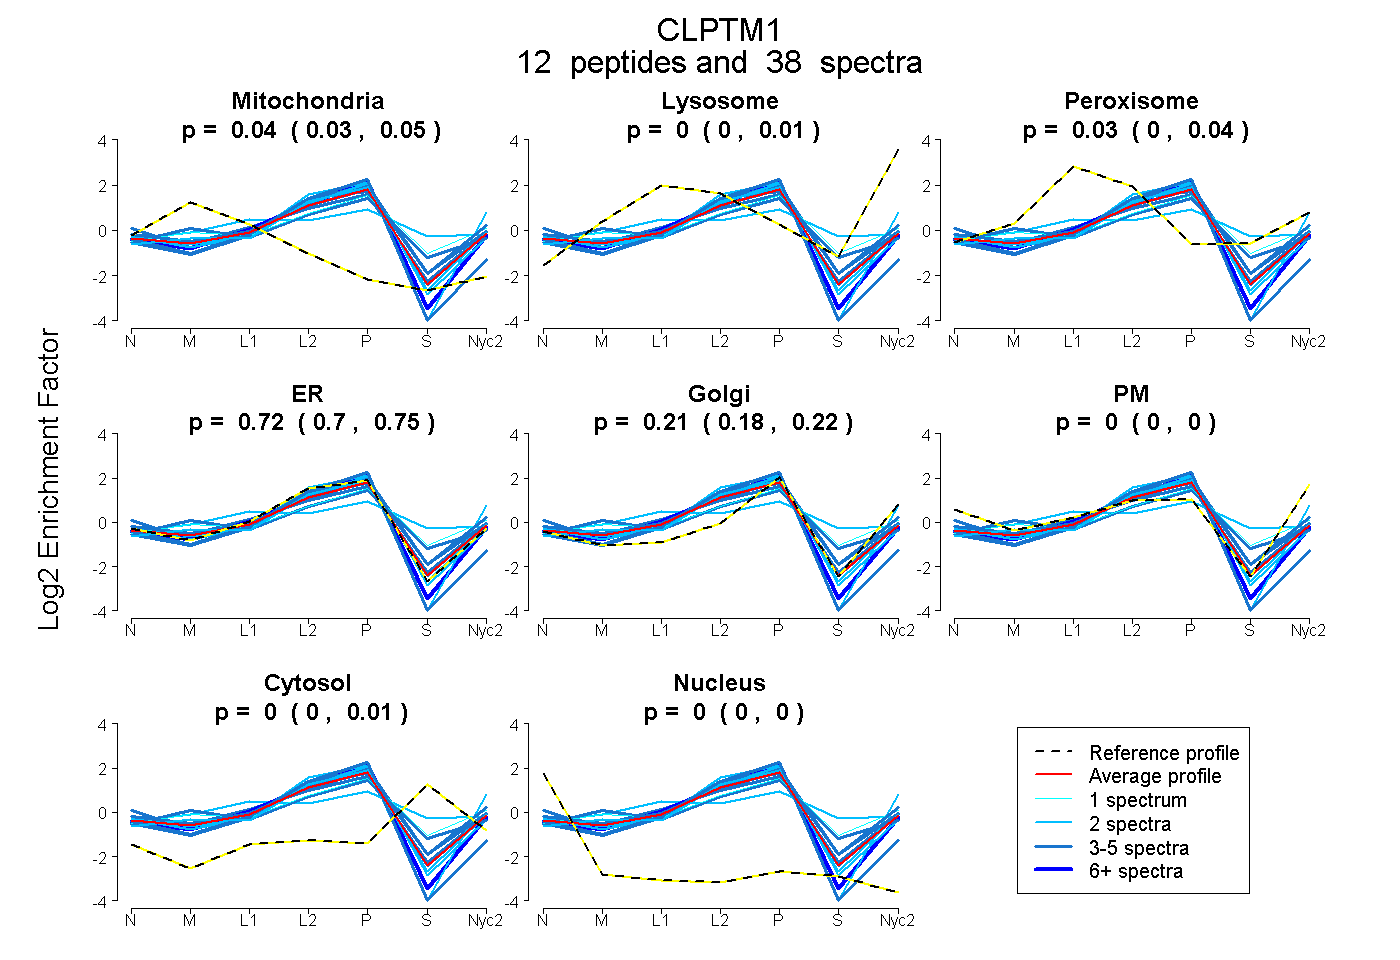
 12
12peptides
spectra
0.028 | 0.050
0.000 | 0.012
0.000 | 0.038
0.699 | 0.746
0.183 | 0.223
0.000 | 0.000
0.000 | 0.015
0.000 | 0.000
| Plot | Mito | Lyso | Perox | ER | Golgi | PM | Cytosol | Nucleus | |||||
| Expt A |
12 peptides |
38 spectra |
|
0.040 0.028 | 0.050 |
0.000 0.000 | 0.012 |
0.027 0.000 | 0.038 |
0.721 0.699 | 0.746 |
0.209 0.183 | 0.223 |
0.000 0.000 | 0.000 |
0.003 0.000 | 0.015 |
0.000 0.000 | 0.000 |
| 2 spectra, WQLYAAQSTK | 0.039 | 0.014 | 0.000 | 0.762 | 0.185 | 0.000 | 0.000 | 0.000 | ||
| 4 spectra, VYDDMAFR | 0.000 | 0.000 | 0.143 | 0.498 | 0.355 | 0.000 | 0.004 | 0.000 | ||
| 1 spectrum, SVAHLPWR | 0.000 | 0.000 | 0.205 | 0.293 | 0.383 | 0.000 | 0.119 | 0.000 | ||
| 3 spectra, NLLTGETEADPEMIK | 0.000 | 0.025 | 0.000 | 0.784 | 0.107 | 0.000 | 0.084 | 0.000 | ||
| 2 spectra, NDIQFWNSR | 0.000 | 0.000 | 0.000 | 0.671 | 0.103 | 0.225 | 0.000 | 0.000 | ||
| 2 spectra, QSLEGLSVR | 0.000 | 0.000 | 0.000 | 0.839 | 0.145 | 0.000 | 0.000 | 0.016 | ||
| 7 spectra, MPVMYR | 0.000 | 0.000 | 0.000 | 0.887 | 0.113 | 0.000 | 0.000 | 0.000 | ||
| 4 spectra, VSFCPLSLWR | 0.000 | 0.000 | 0.000 | 0.949 | 0.000 | 0.000 | 0.000 | 0.051 | ||
| 5 spectra, GPSPQDQSGPGGAPR | 0.000 | 0.000 | 0.000 | 0.799 | 0.016 | 0.147 | 0.017 | 0.022 | ||
| 2 spectra, LATVHMSR | 0.018 | 0.000 | 0.360 | 0.165 | 0.243 | 0.000 | 0.214 | 0.000 | ||
| 3 spectra, GSVPPPLDQYVK | 0.051 | 0.000 | 0.089 | 0.616 | 0.234 | 0.000 | 0.010 | 0.000 | ||
| 3 spectra, STYIESSTK | 0.081 | 0.000 | 0.112 | 0.459 | 0.222 | 0.000 | 0.127 | 0.000 |
| Plot | Mito | Lyso or Perox | ER | Golgi | PM | Cytosol | Nucleus | ||||||
| Expt B |
4 peptides |
6 spectra |
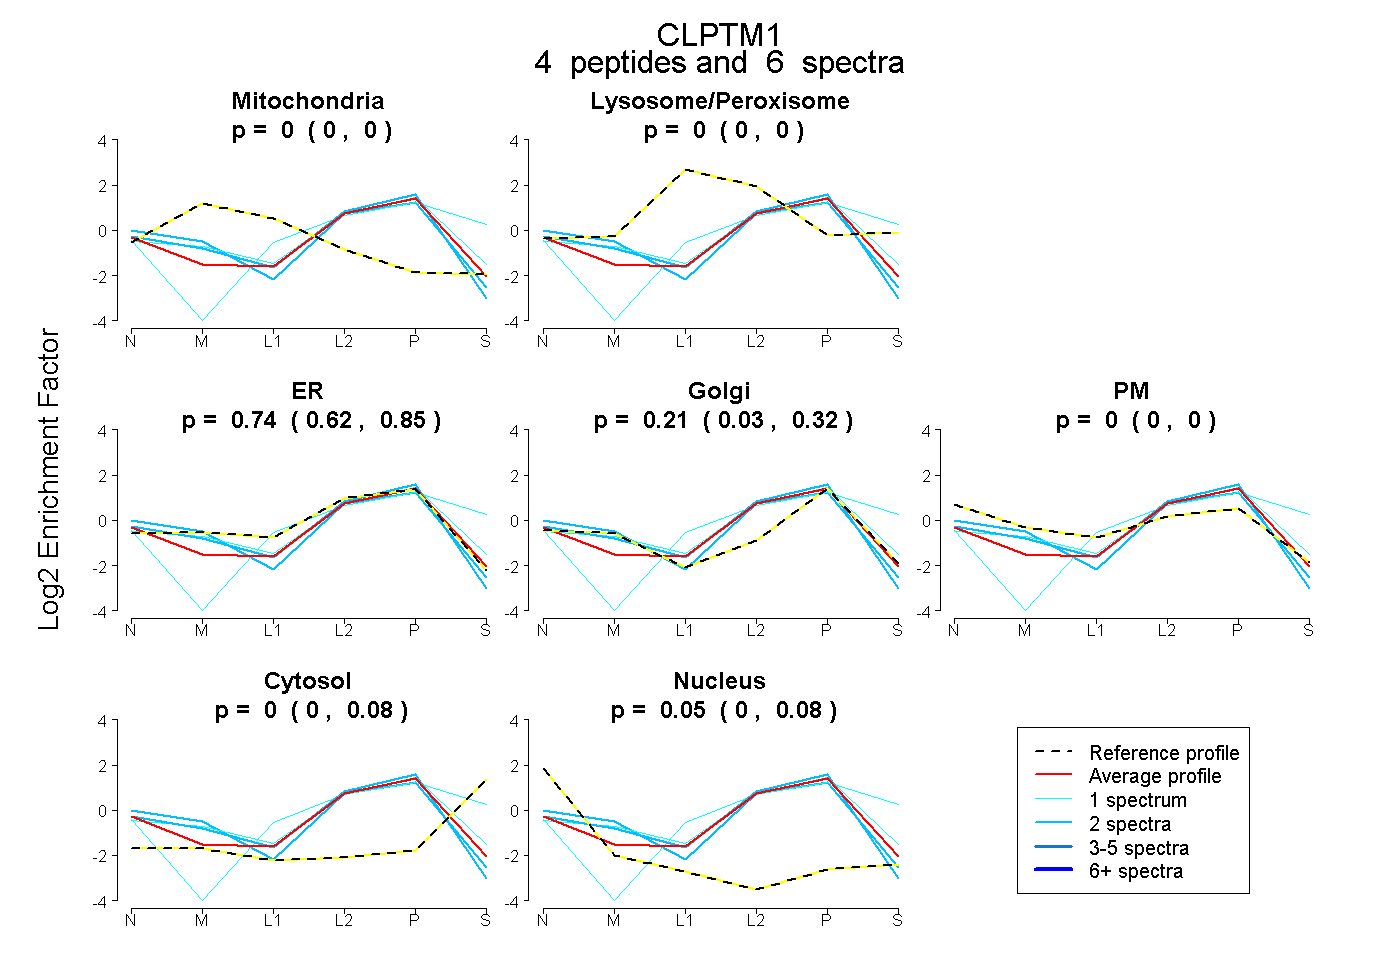 |
0.000 0.000 | 0.000 |
0.000 0.000 | 0.000 |
0.738 0.622 | 0.854 |
0.213 0.035 | 0.321 |
0.000 0.000 | 0.000 |
0.004 0.000 | 0.082 |
0.046 0.000 | 0.082 |
|||
| Plot | Lyso | Other | |||||||||||
| Expt C |
8 peptides |
42 spectra |
 |
0.000 0.000 | 0.000 |
1.000 1.000 | 1.000 |
||||||||
| Plot | Lyso | Other | |||||||||||
| Expt D |
4 peptides |
7 spectra |
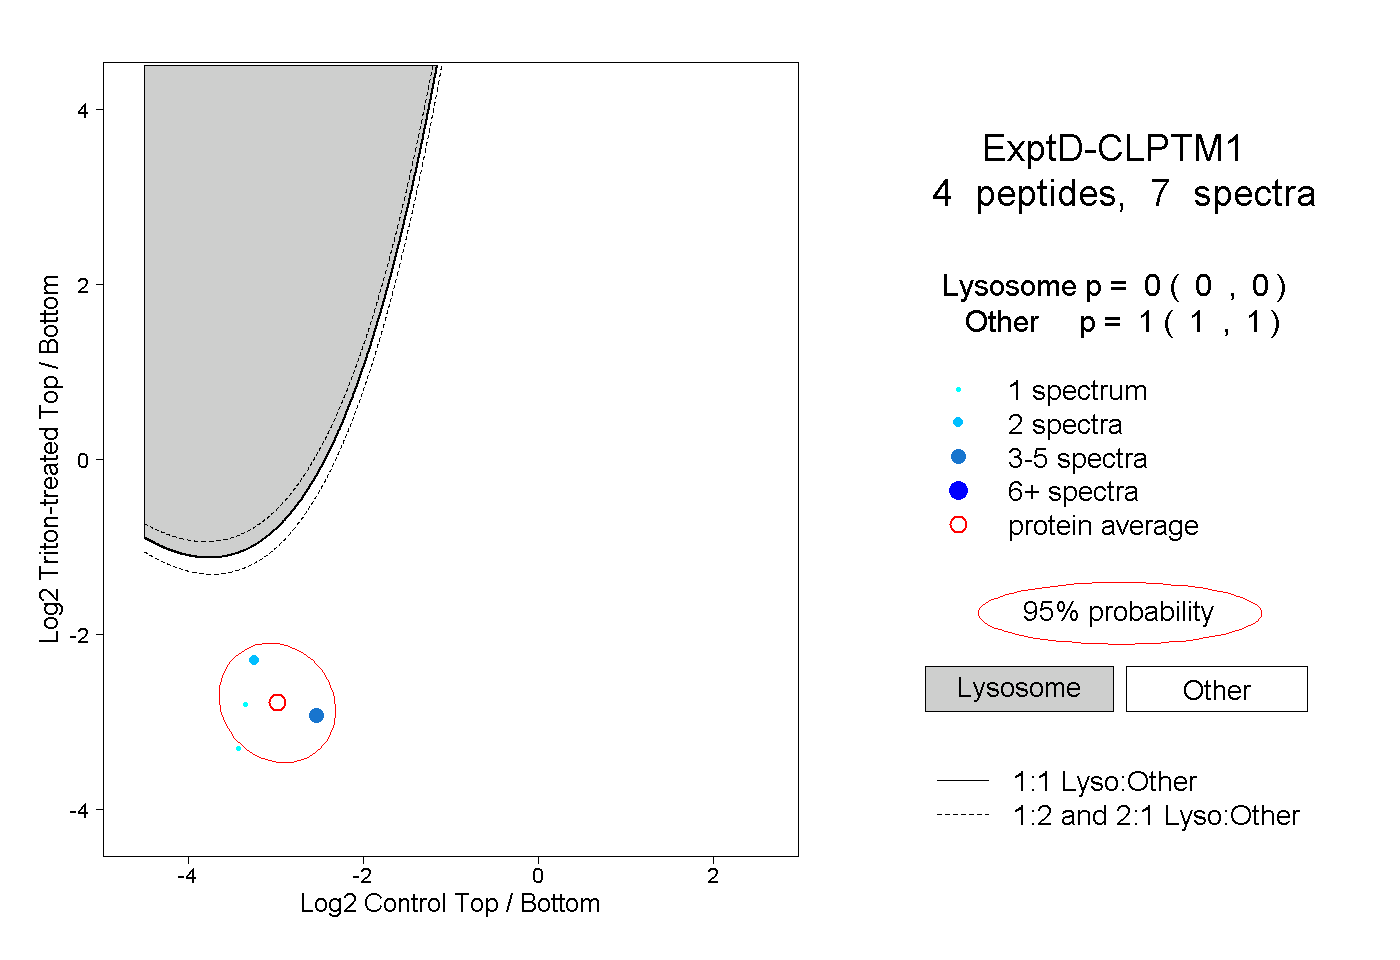 |
0.000 0.000 | 0.000 |
1.000 1.000 | 1.000 |