 11
11peptides
spectra
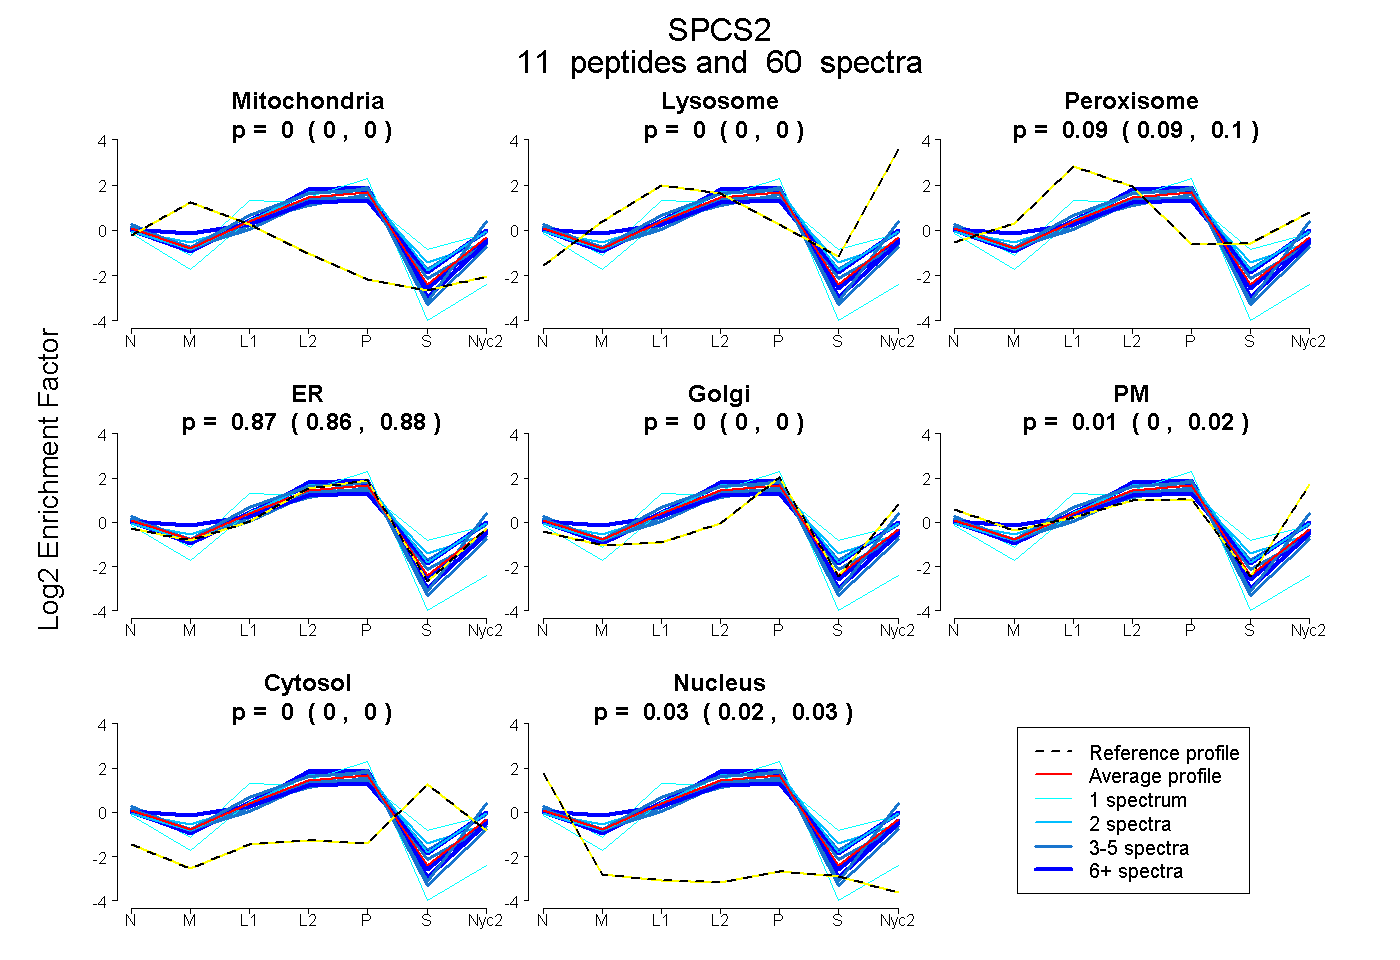
0.000 | 0.000
0.000 | 0.000
0.086 | 0.101
0.856 | 0.876
0.000 | 0.000
0.000 | 0.024
0.000 | 0.000
0.024 | 0.029
8peptides
spectra
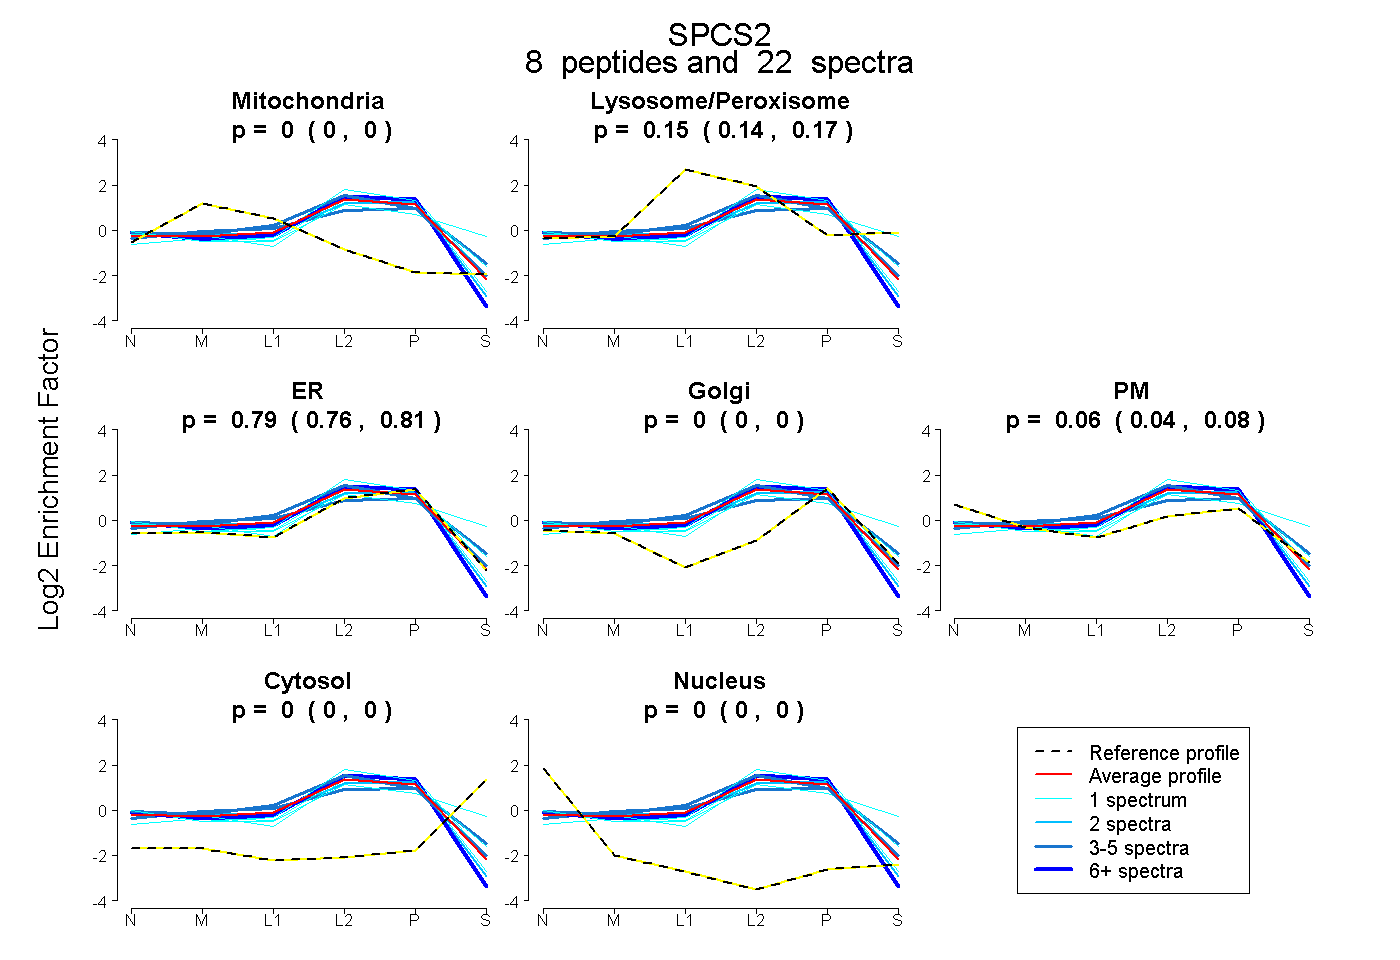
0.000 | 0.000
0.136 | 0.170
0.758 | 0.814
0.000 | 0.000
0.035 | 0.076
0.000 | 0.000
0.000 | 0.000
10peptides
spectra
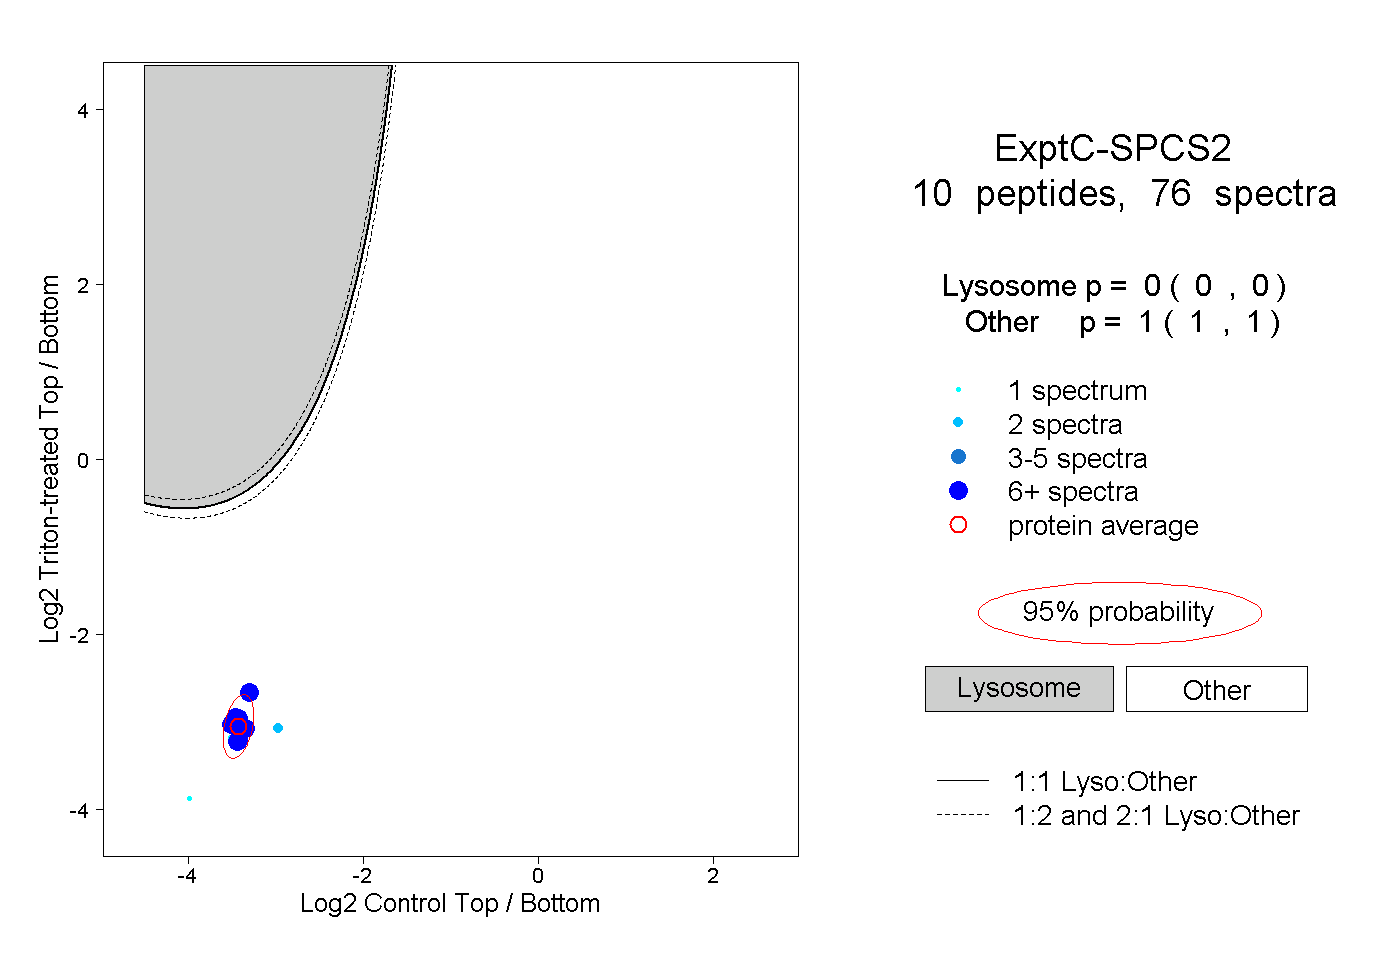
0.000 | 0.000
1.000 | 1.000
4peptides
spectra
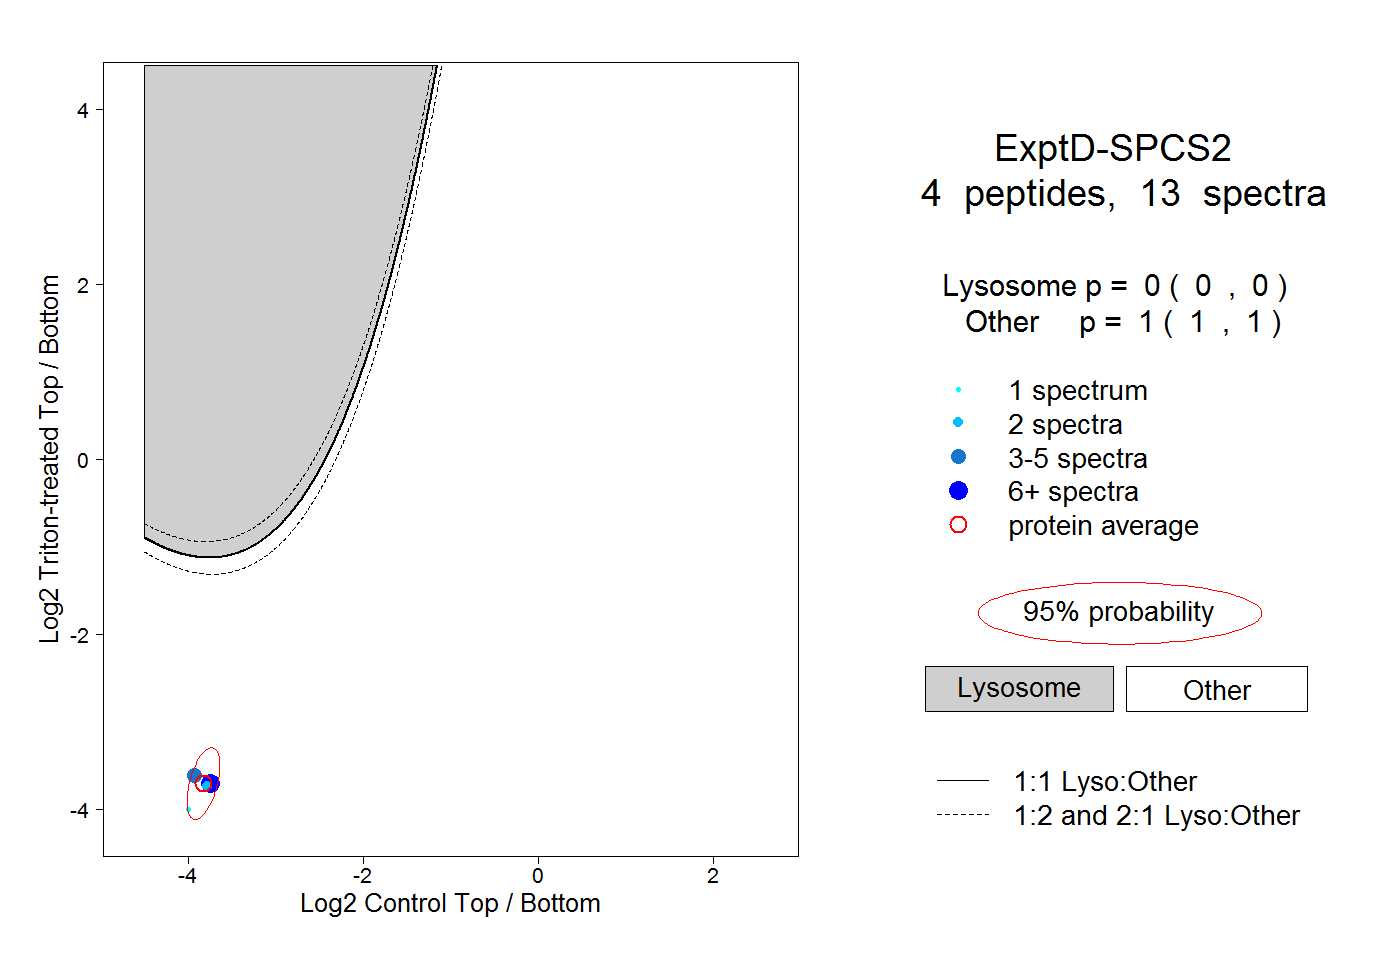
0.000 | 0.000
1.000 | 1.000