 11
11peptides
spectra
0.000 | 0.000
0.000 | 0.000
0.086 | 0.101
0.856 | 0.876
0.000 | 0.000
0.000 | 0.024
0.000 | 0.000
0.024 | 0.029
| Plot | Mito | Lyso | Perox | ER | Golgi | PM | Cytosol | Nucleus | |||||
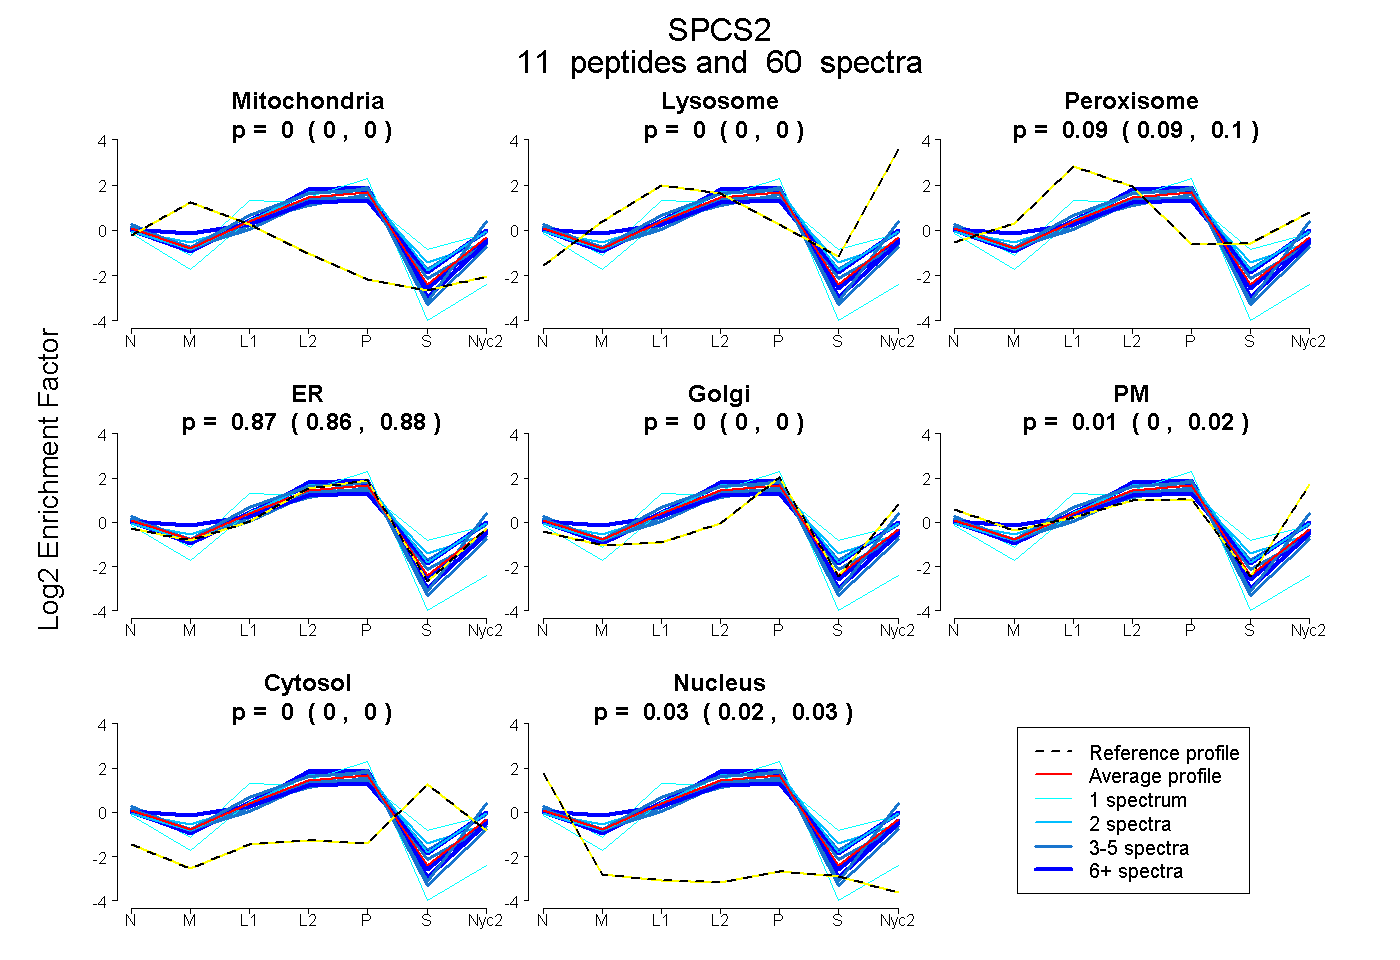
| Expt A |
11 peptides |
60 spectra |
|
0.000 0.000 | 0.000 |
0.000 0.000 | 0.000 |
0.094 0.086 | 0.101 |
0.867 0.856 | 0.876 |
0.000 0.000 | 0.000 |
0.012 0.000 | 0.024 |
0.000 0.000 | 0.000 |
0.027 0.024 | 0.029 |
| 4 spectra, YVENFGLIDGR | 0.000 | 0.000 | 0.007 | 0.704 | 0.000 | 0.289 | 0.000 | 0.000 | ||
| 4 spectra, SGLLDK | 0.000 | 0.000 | 0.000 | 0.945 | 0.000 | 0.000 | 0.000 | 0.055 | ||
| 6 spectra, EAEFTK | 0.000 | 0.000 | 0.062 | 0.935 | 0.000 | 0.000 | 0.000 | 0.002 | ||
| 2 spectra, WDGSAVK | 0.000 | 0.000 | 0.135 | 0.812 | 0.000 | 0.022 | 0.031 | 0.000 | ||
| 1 spectrum, FFDHSGTLVMDAYEPEISR | 0.000 | 0.000 | 0.344 | 0.538 | 0.000 | 0.000 | 0.117 | 0.000 | ||
| 5 spectra, NSLDDSAK | 0.000 | 0.000 | 0.101 | 0.678 | 0.000 | 0.132 | 0.087 | 0.002 | ||
| 17 spectra, LTFISGR | 0.000 | 0.000 | 0.000 | 1.000 | 0.000 | 0.000 | 0.000 | 0.000 | ||
| 2 spectra, DPTGMDPDDIWQLSSSLK | 0.017 | 0.000 | 0.147 | 0.713 | 0.000 | 0.000 | 0.123 | 0.001 | ||
| 3 spectra, LHDSLATER | 0.000 | 0.000 | 0.121 | 0.802 | 0.000 | 0.000 | 0.000 | 0.077 | ||
| 1 spectrum, SGGGGGSSGPGGGPSCGTSSSR | 0.000 | 0.000 | 0.000 | 0.902 | 0.000 | 0.000 | 0.000 | 0.098 | ||
| 15 spectra, SIFLVAHR | 0.066 | 0.000 | 0.147 | 0.570 | 0.054 | 0.143 | 0.020 | 0.000 |
| Plot | Mito | Lyso or Perox | ER | Golgi | PM | Cytosol | Nucleus | ||||||
| Expt B |
8 peptides |
22 spectra |
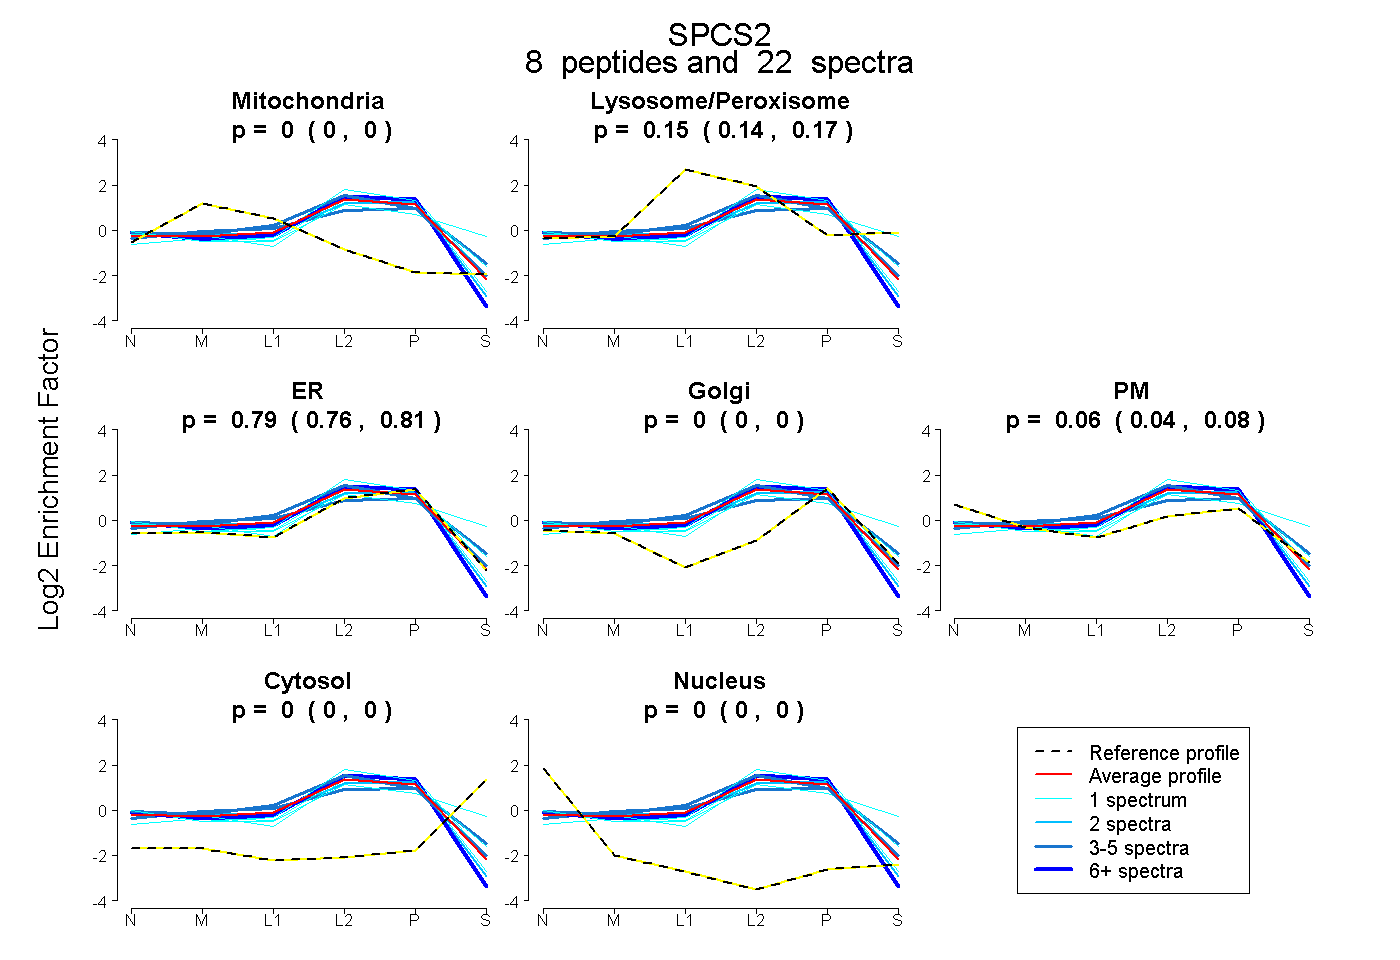 |
0.000 0.000 | 0.000 |
0.155 0.136 | 0.170 |
0.787 0.758 | 0.814 |
0.000 0.000 | 0.000 |
0.058 0.035 | 0.076 |
0.000 0.000 | 0.000 |
0.000 0.000 | 0.000 |
|||
| Plot | Lyso | Other | |||||||||||
| Expt C |
10 peptides |
76 spectra |
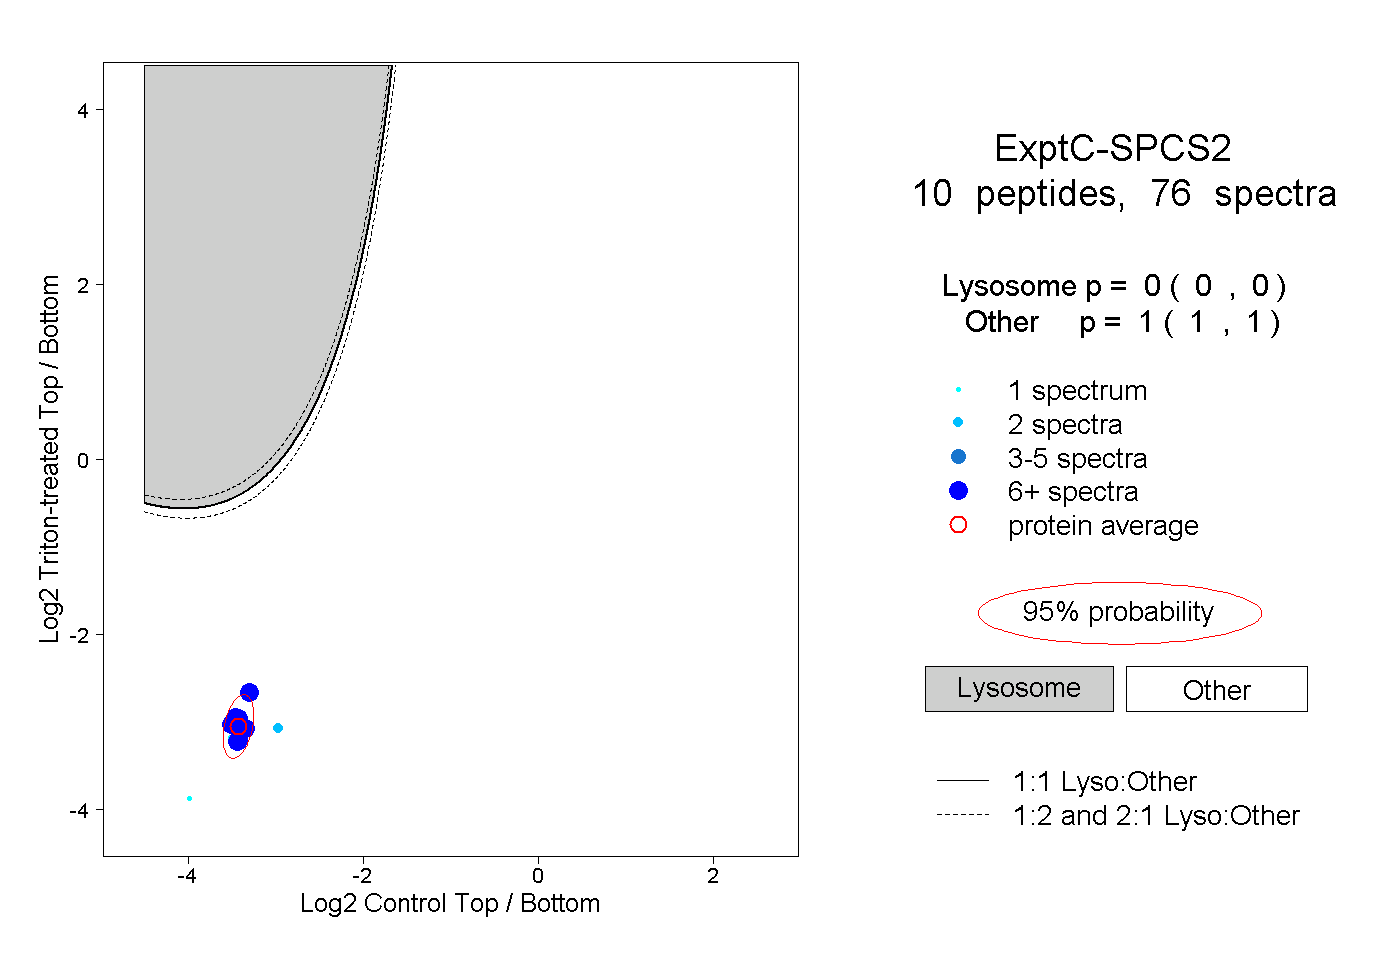 |
0.000 0.000 | 0.000 |
1.000 1.000 | 1.000 |
||||||||
| Plot | Lyso | Other | |||||||||||
| Expt D |
4 peptides |
13 spectra |
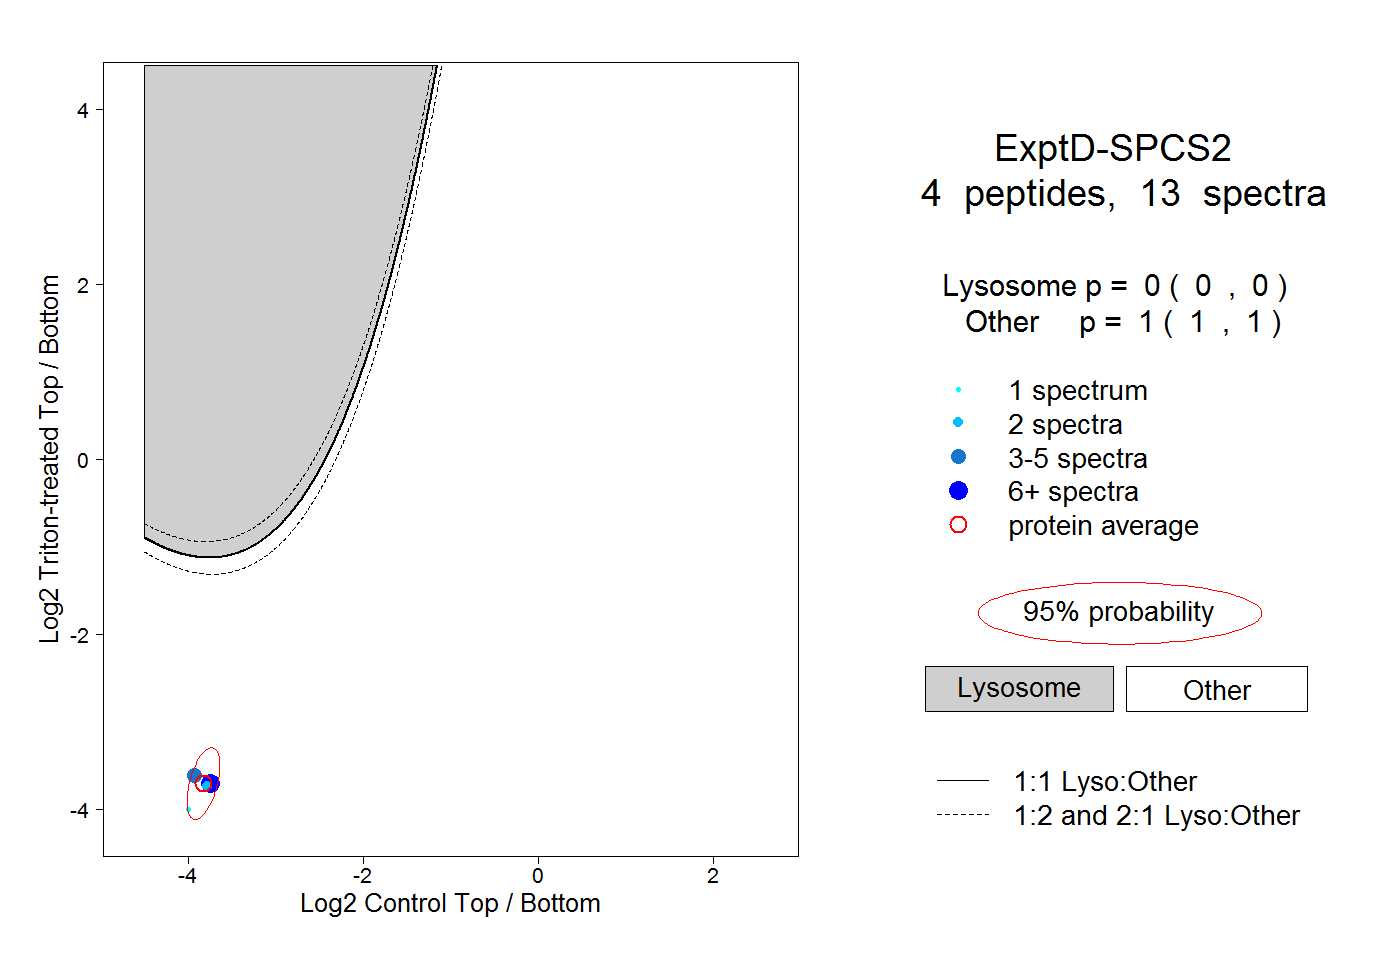 |
0.000 0.000 | 0.000 |
1.000 1.000 | 1.000 |