 22
22peptides
spectra
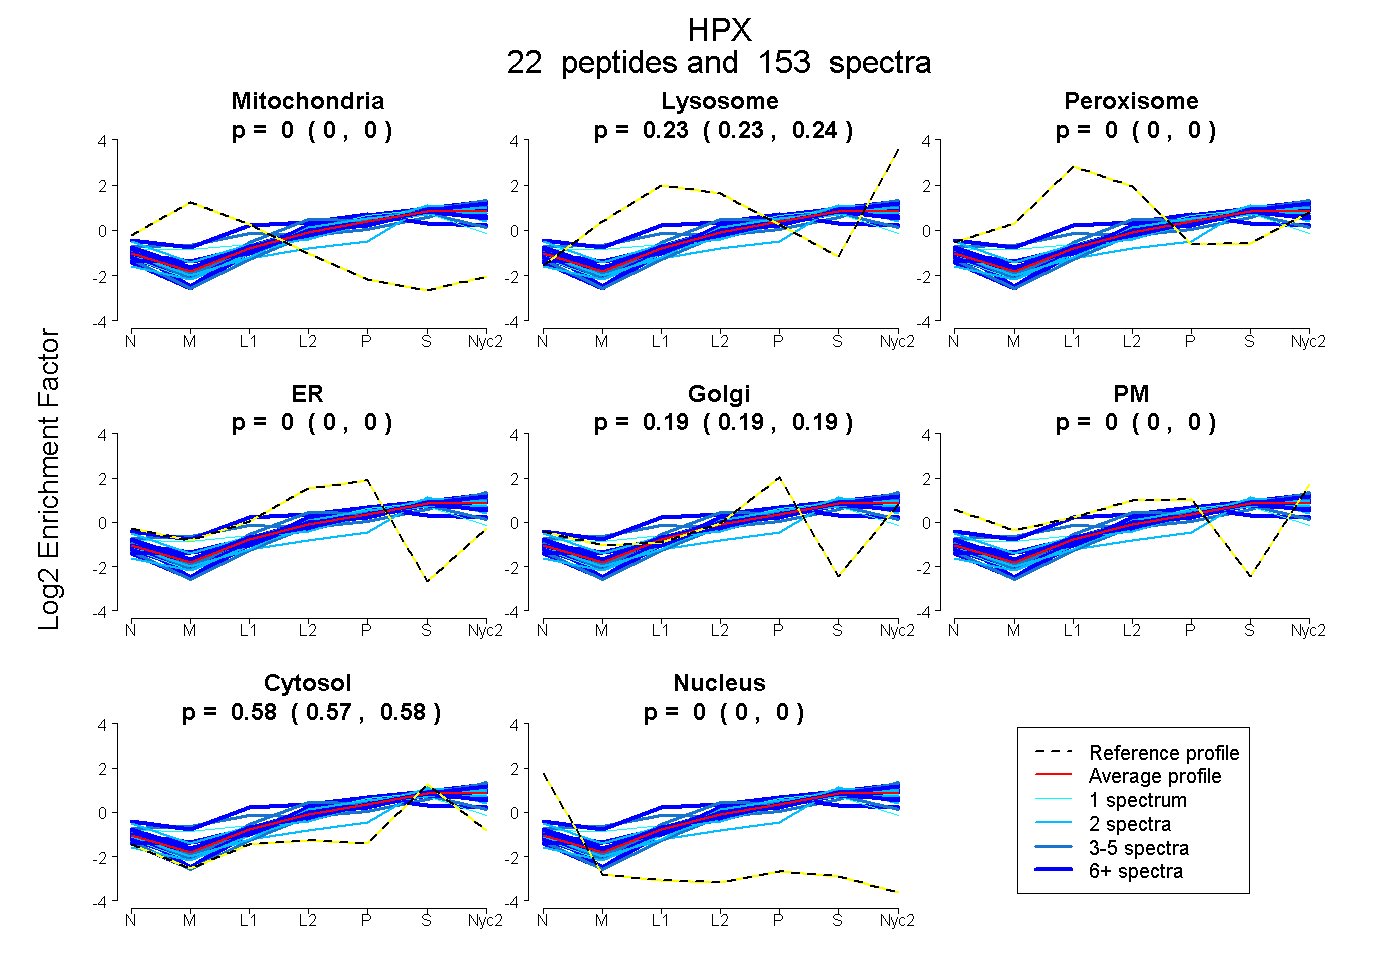
0.000 | 0.000
0.232 | 0.236
0.000 | 0.000
0.000 | 0.000
0.189 | 0.192
0.000 | 0.000
0.574 | 0.577
0.000 | 0.000
13peptides
spectra
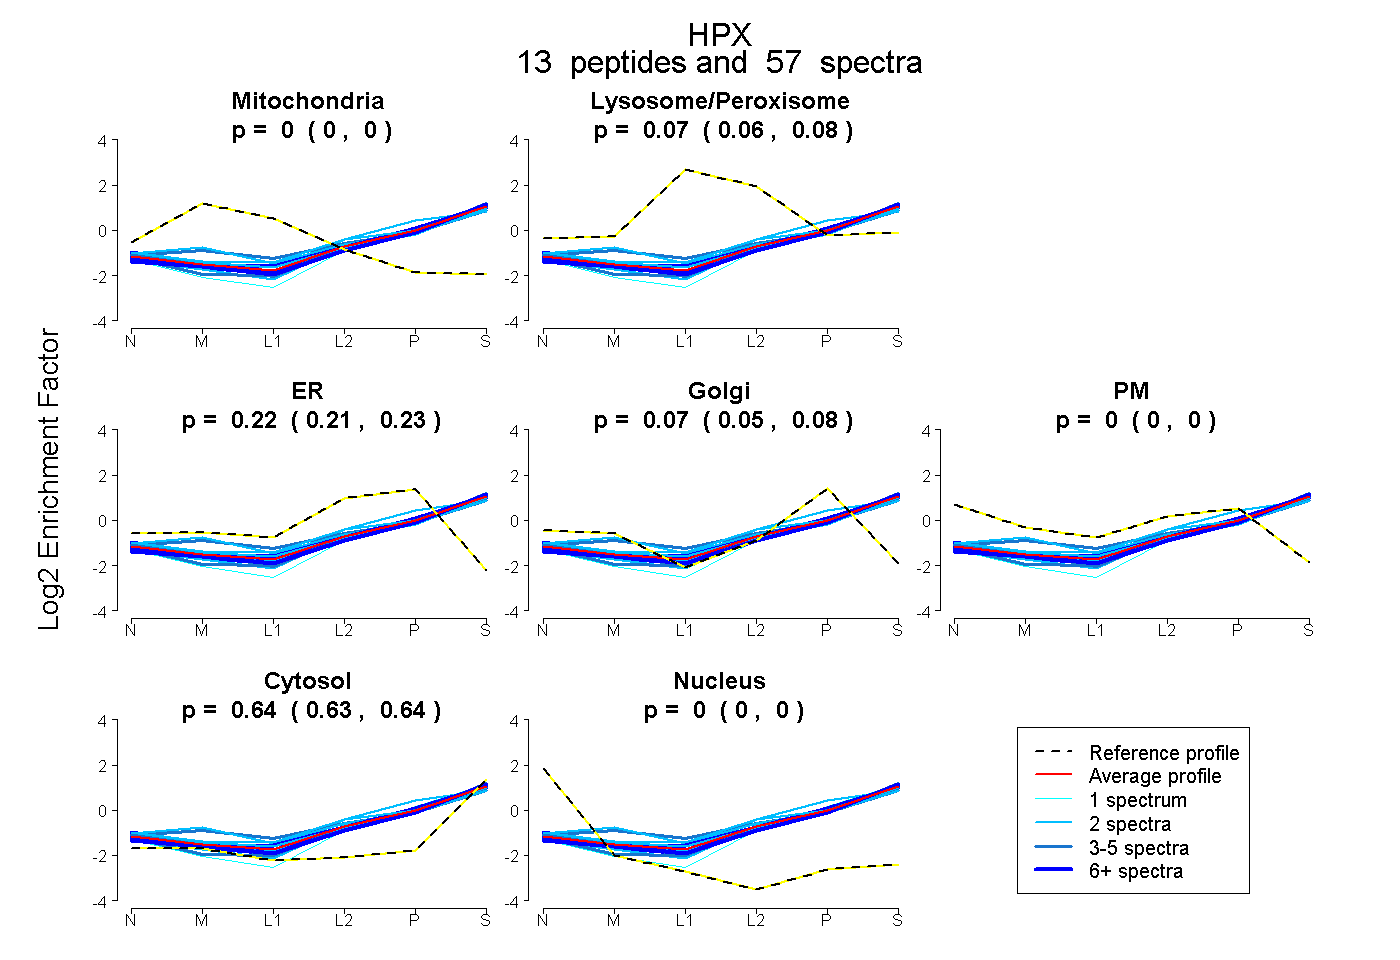
0.000 | 0.000
0.063 | 0.077
0.206 | 0.235
0.055 | 0.079
0.000 | 0.000
0.635 | 0.644
0.000 | 0.000
21peptides
spectra
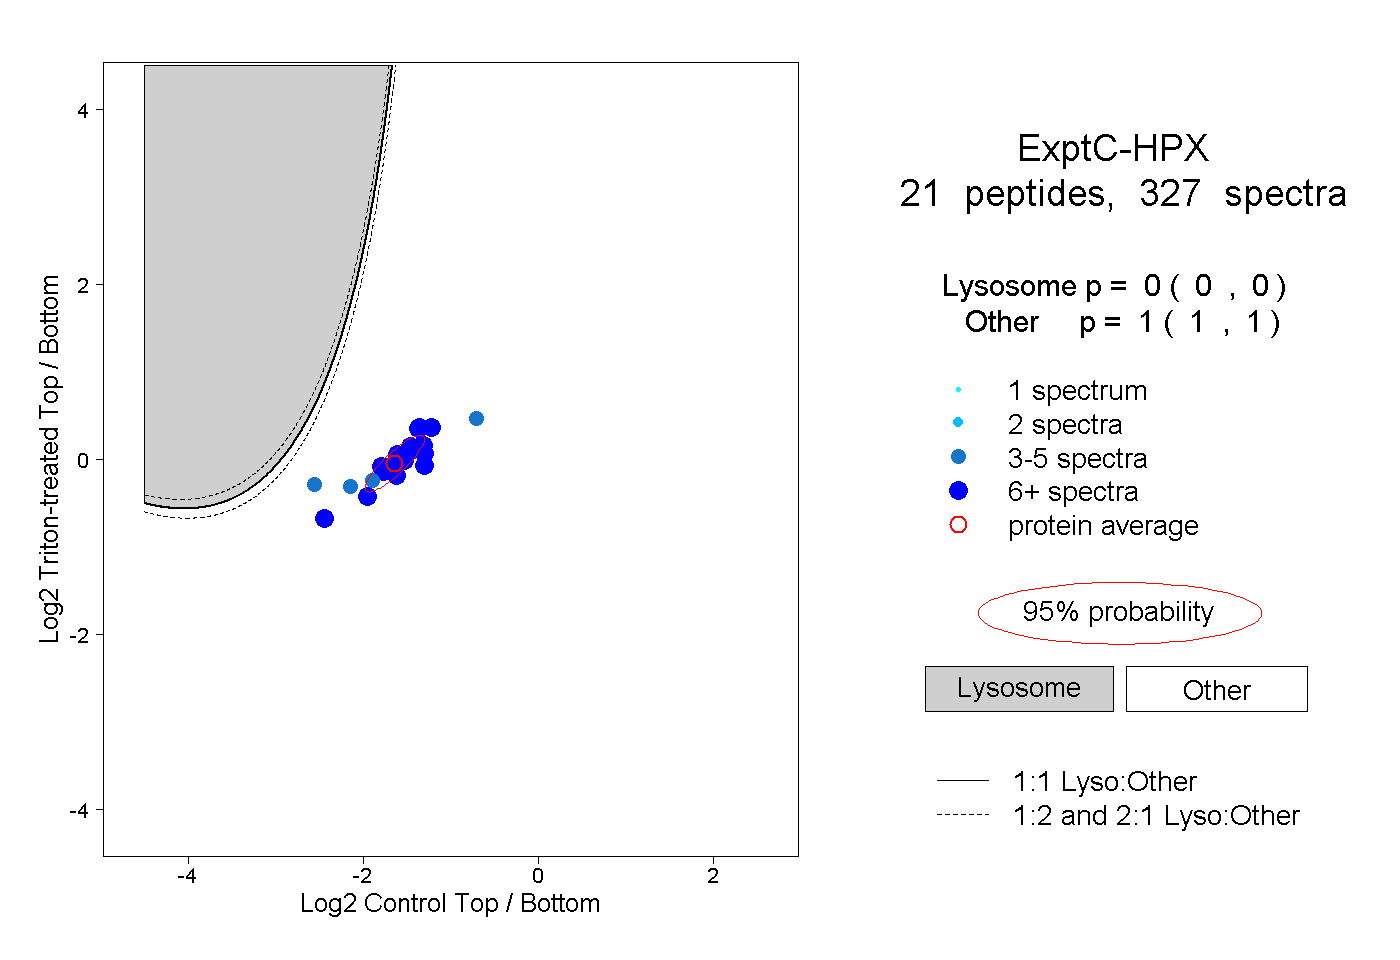
0.000 | 0.000
1.000 | 1.000
15peptides
spectra
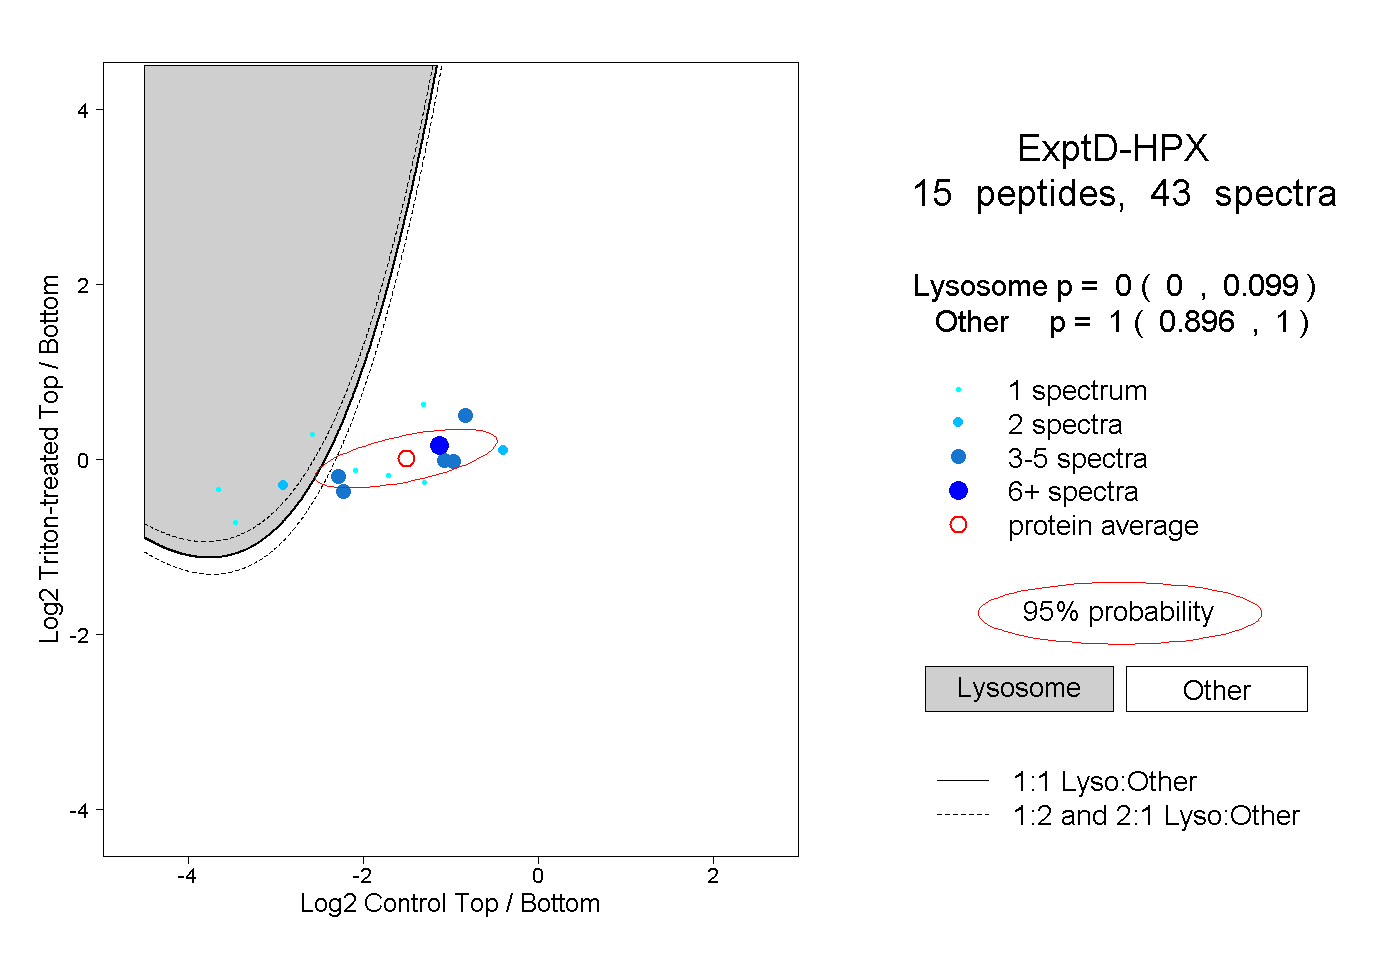
0.000 | 0.099
0.896 | 1.000