 9
9peptides
spectra
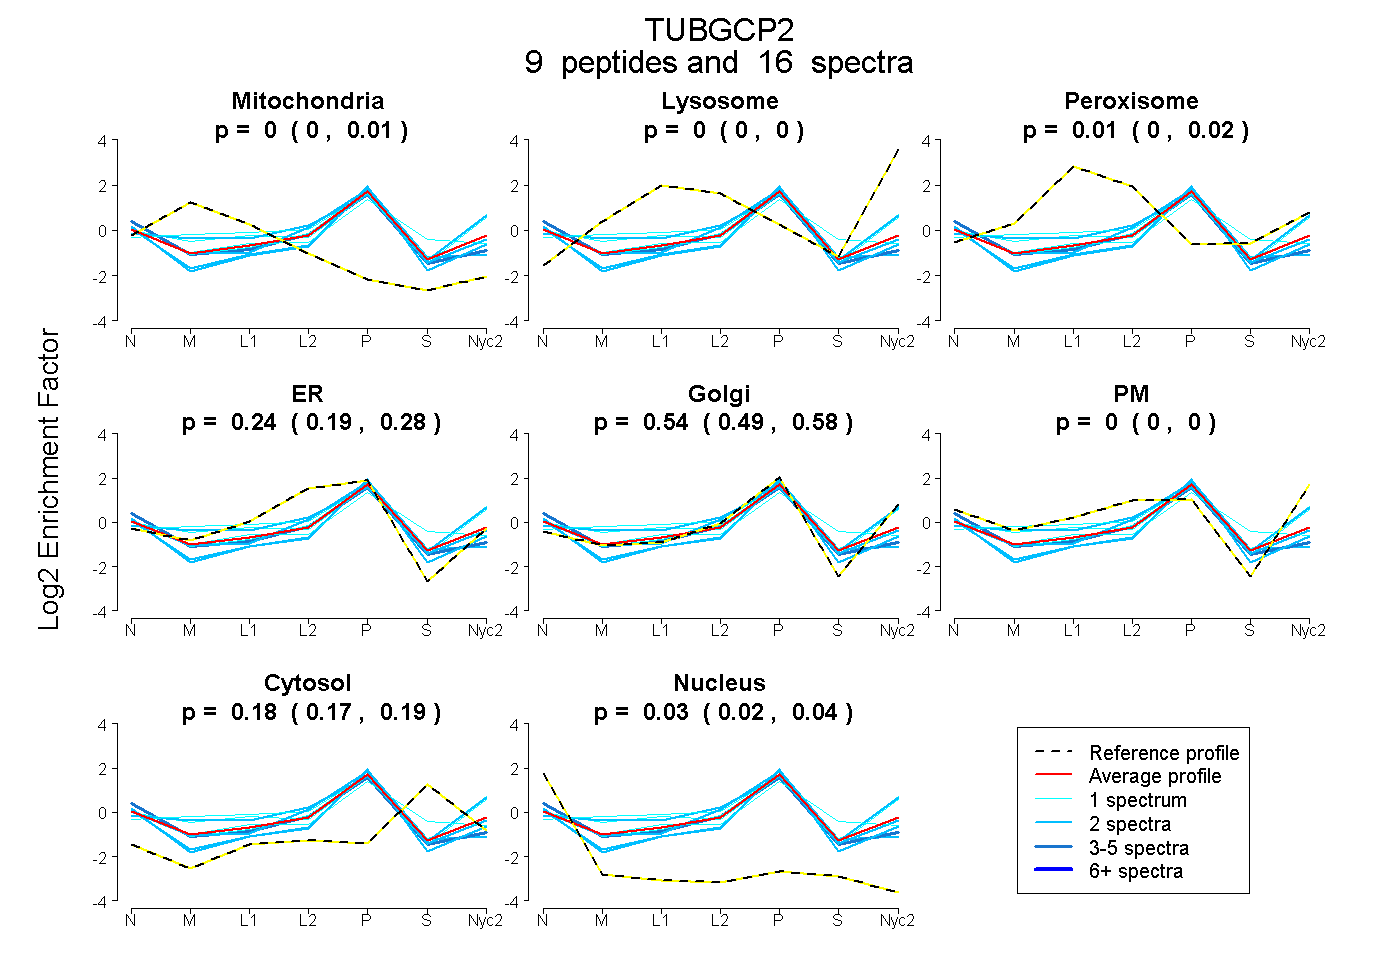
0.000 | 0.008
0.000 | 0.000
0.000 | 0.024
0.190 | 0.279
0.488 | 0.578
0.000 | 0.000
0.166 | 0.194
0.025 | 0.041
1peptide
spectrum
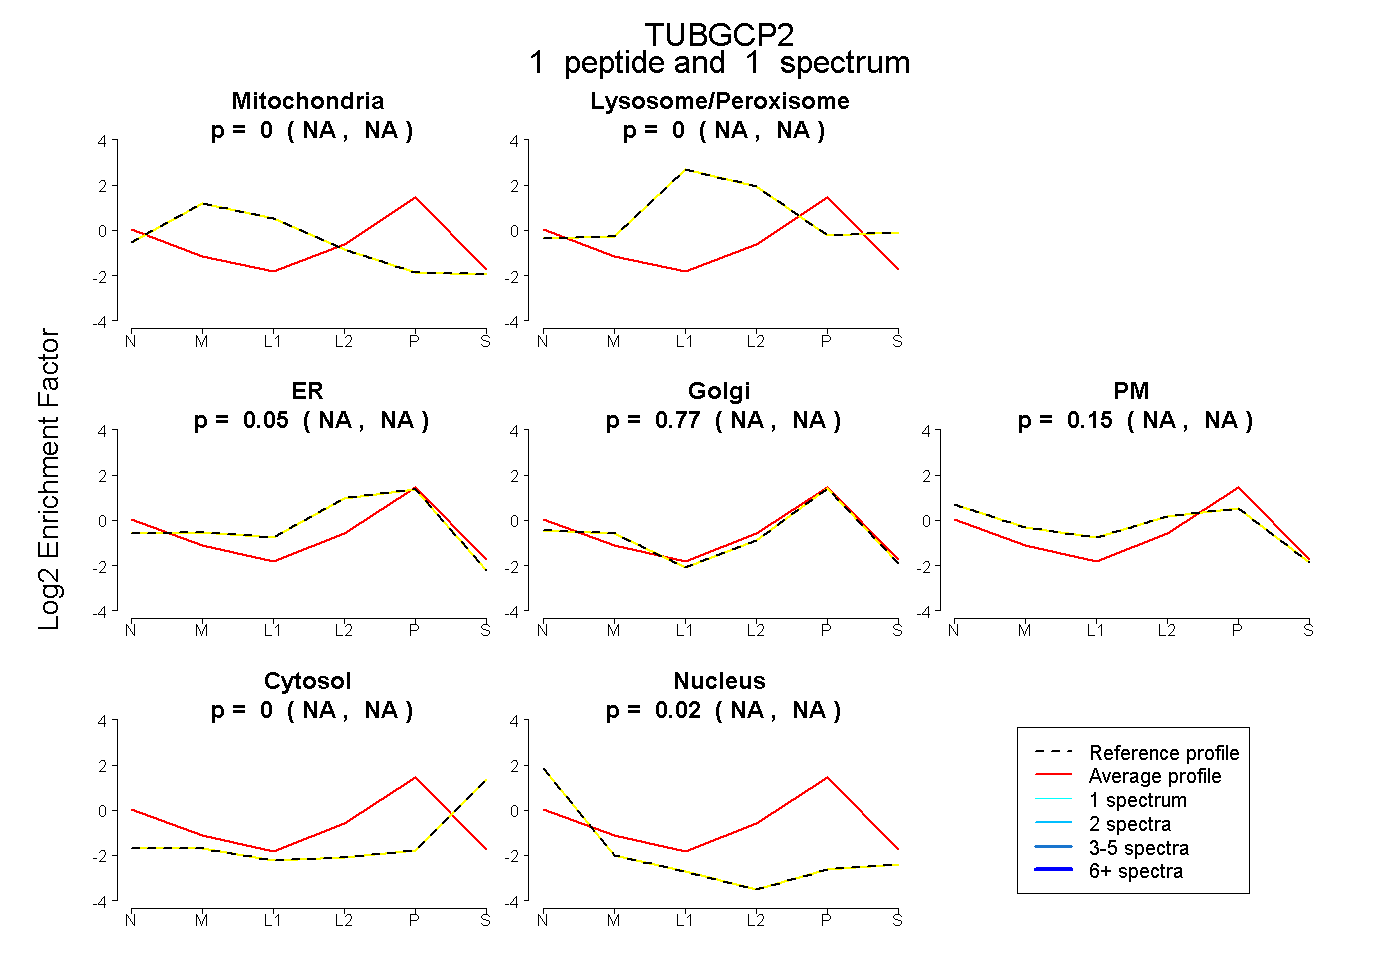
NA | NA
NA | NA
NA | NA
NA | NA
NA | NA
NA | NA
NA | NA
4peptides
spectra

0.000 | 0.000
1.000 | 1.000