 9
9peptides
spectra
0.000 | 0.008
0.000 | 0.000
0.000 | 0.024
0.190 | 0.279
0.488 | 0.578
0.000 | 0.000
0.166 | 0.194
0.025 | 0.041
| Plot | Mito | Lyso | Perox | ER | Golgi | PM | Cytosol | Nucleus | |||||
| Expt A |
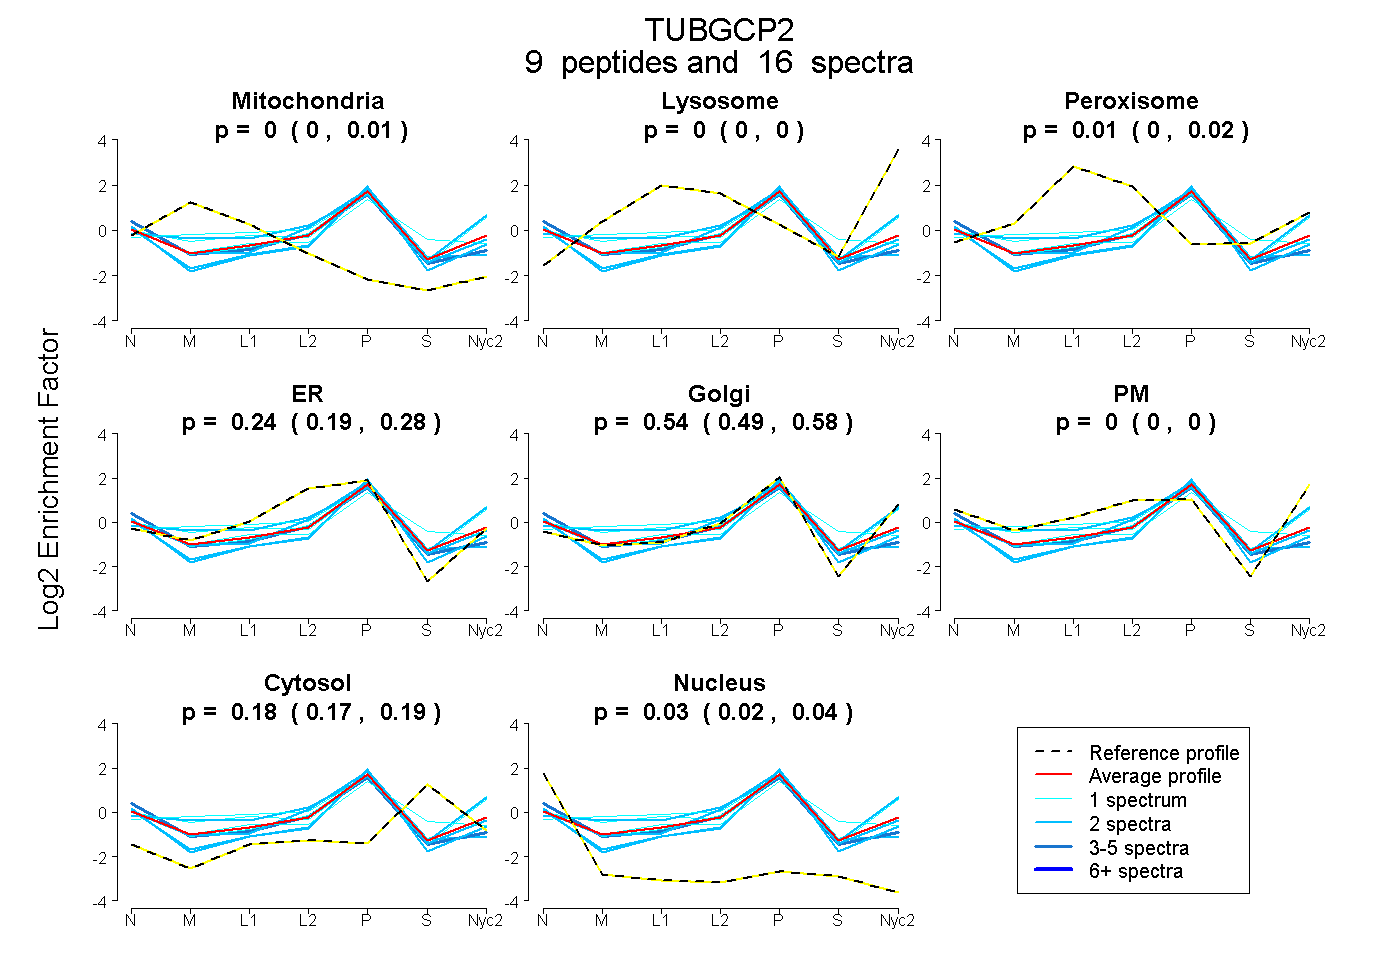
9 peptides |
16 spectra |
|
0.000 0.000 | 0.008 |
0.000 0.000 | 0.000 |
0.007 0.000 | 0.024 |
0.240 0.190 | 0.279 |
0.536 0.488 | 0.578 |
0.000 0.000 | 0.000 |
0.182 0.166 | 0.194 |
0.034 0.025 | 0.041 |
| 1 spectrum, IDDRPR | 0.006 | 0.000 | 0.147 | 0.000 | 0.688 | 0.060 | 0.099 | 0.000 | ||
| 2 spectra, NLDPLVYLLSK | 0.000 | 0.000 | 0.000 | 0.095 | 0.675 | 0.000 | 0.076 | 0.154 | ||
| 1 spectrum, NFSAHLLDLLAR | 0.031 | 0.000 | 0.212 | 0.000 | 0.732 | 0.000 | 0.025 | 0.000 | ||
| 2 spectra, KPVEDITPTR | 0.000 | 0.000 | 0.177 | 0.000 | 0.689 | 0.064 | 0.070 | 0.000 | ||
| 2 spectra, YITAQPLAGR | 0.000 | 0.000 | 0.000 | 0.347 | 0.455 | 0.000 | 0.156 | 0.043 | ||
| 1 spectrum, YTVLPQQIPSFLQK | 0.015 | 0.000 | 0.026 | 0.220 | 0.383 | 0.000 | 0.345 | 0.011 | ||
| 1 spectrum, ILPVAASYSTVTR | 0.000 | 0.000 | 0.000 | 0.278 | 0.491 | 0.000 | 0.200 | 0.031 | ||
| 2 spectra, AAPQVPVPR | 0.000 | 0.000 | 0.000 | 0.219 | 0.464 | 0.000 | 0.189 | 0.129 | ||
| 4 spectra, GPPAPASR | 0.000 | 0.000 | 0.000 | 0.420 | 0.312 | 0.000 | 0.132 | 0.136 |
| Plot | Mito | Lyso or Perox | ER | Golgi | PM | Cytosol | Nucleus | ||||||
| Expt B |
1 peptide |
1 spectrum |
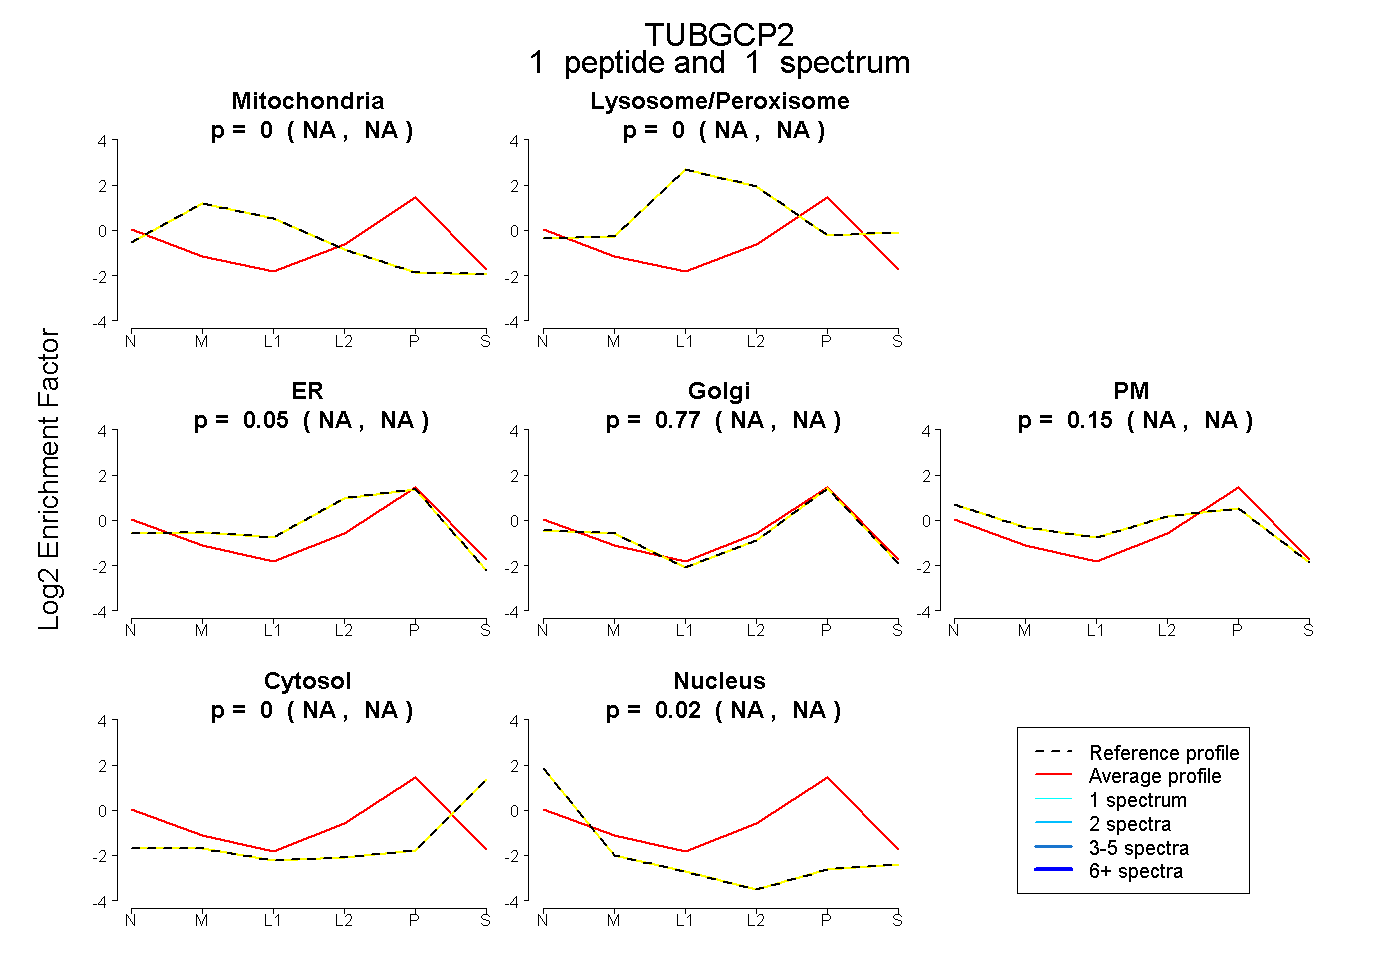 |
0.000 NA | NA |
0.003 NA | NA |
0.054 NA | NA |
0.771 NA | NA |
0.150 NA | NA |
0.000 NA | NA |
0.022 NA | NA |
|||
| Plot | Lyso | Other | |||||||||||
| Expt C |
4 peptides |
5 spectra |
 |
0.000 0.000 | 0.000 |
1.000 1.000 | 1.000 |