 7
7peptides
spectra
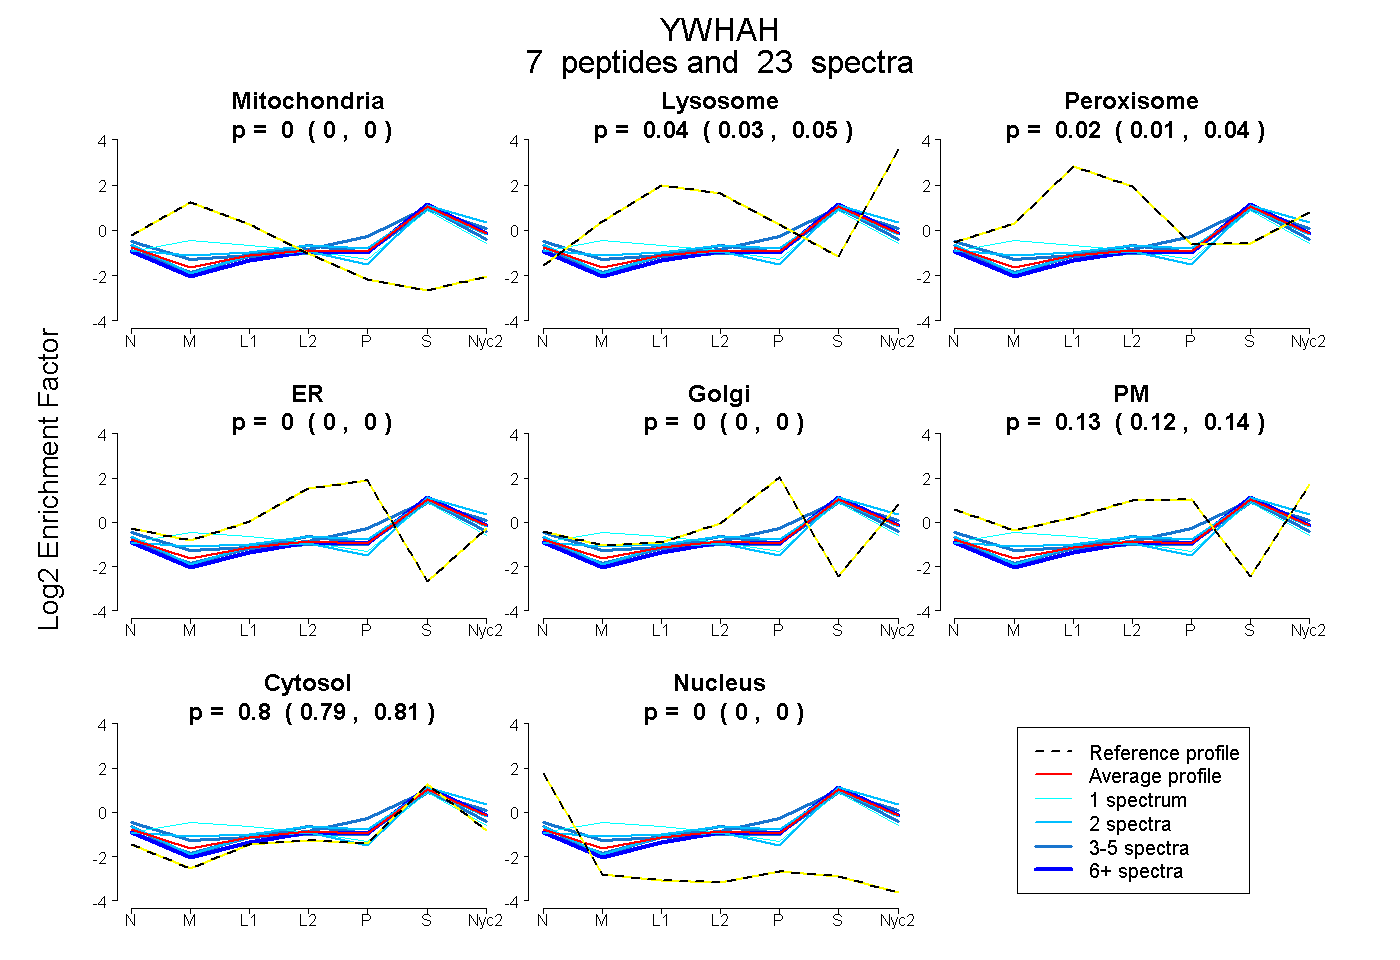
0.000 | 0.002
0.028 | 0.052
0.012 | 0.036
0.000 | 0.000
0.000 | 0.000
0.123 | 0.142
0.793 | 0.805
0.000 | 0.000
2peptides
spectra
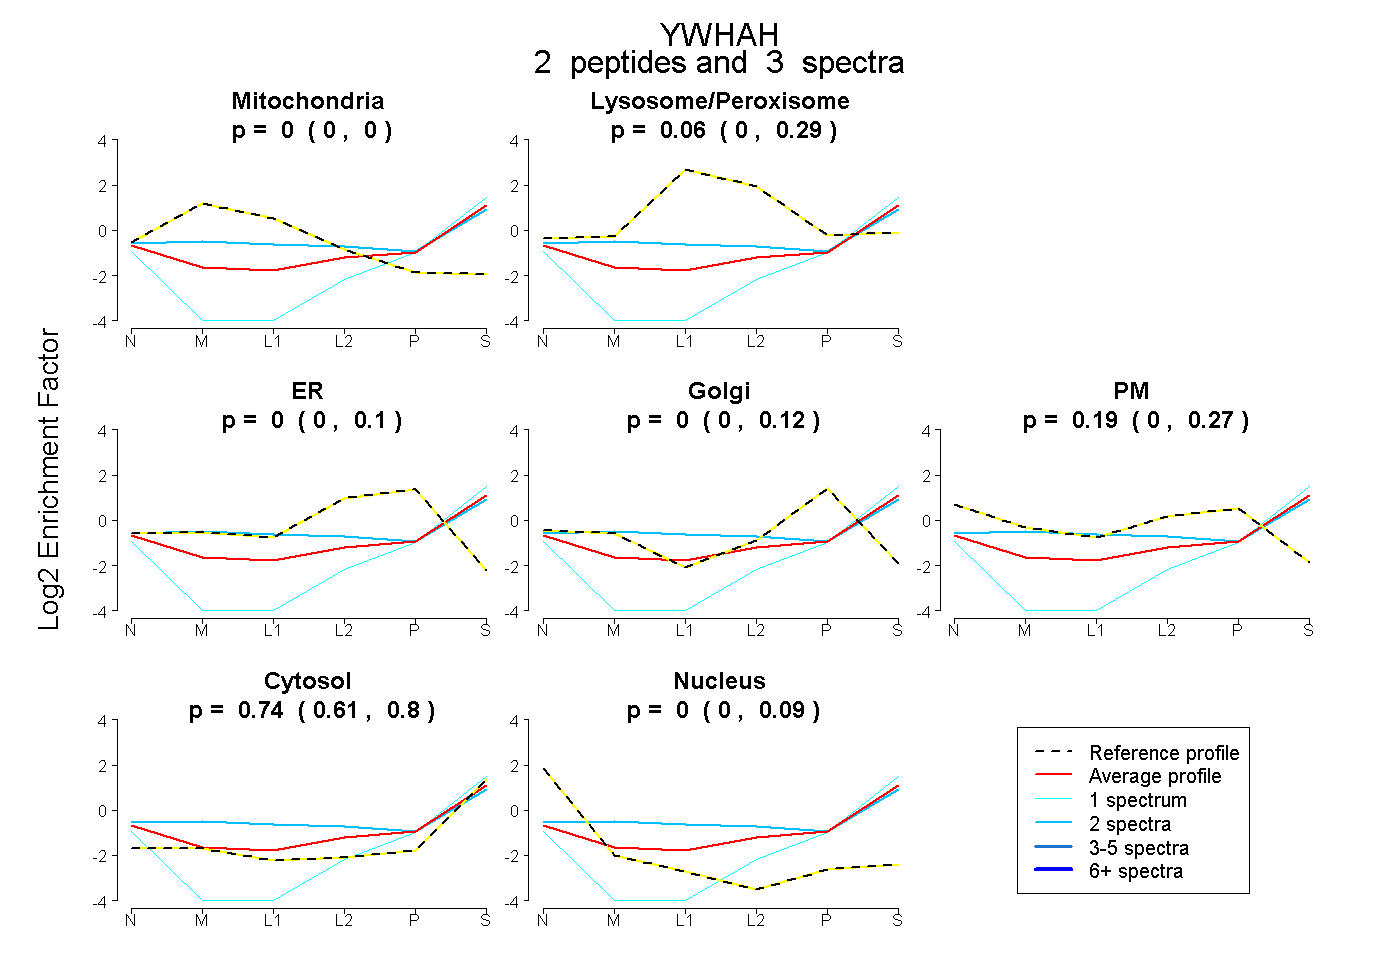
0.000 | 0.000
0.000 | 0.286
0.000 | 0.098
0.000 | 0.116
0.000 | 0.266
0.612 | 0.799
0.000 | 0.086
6peptides
spectra
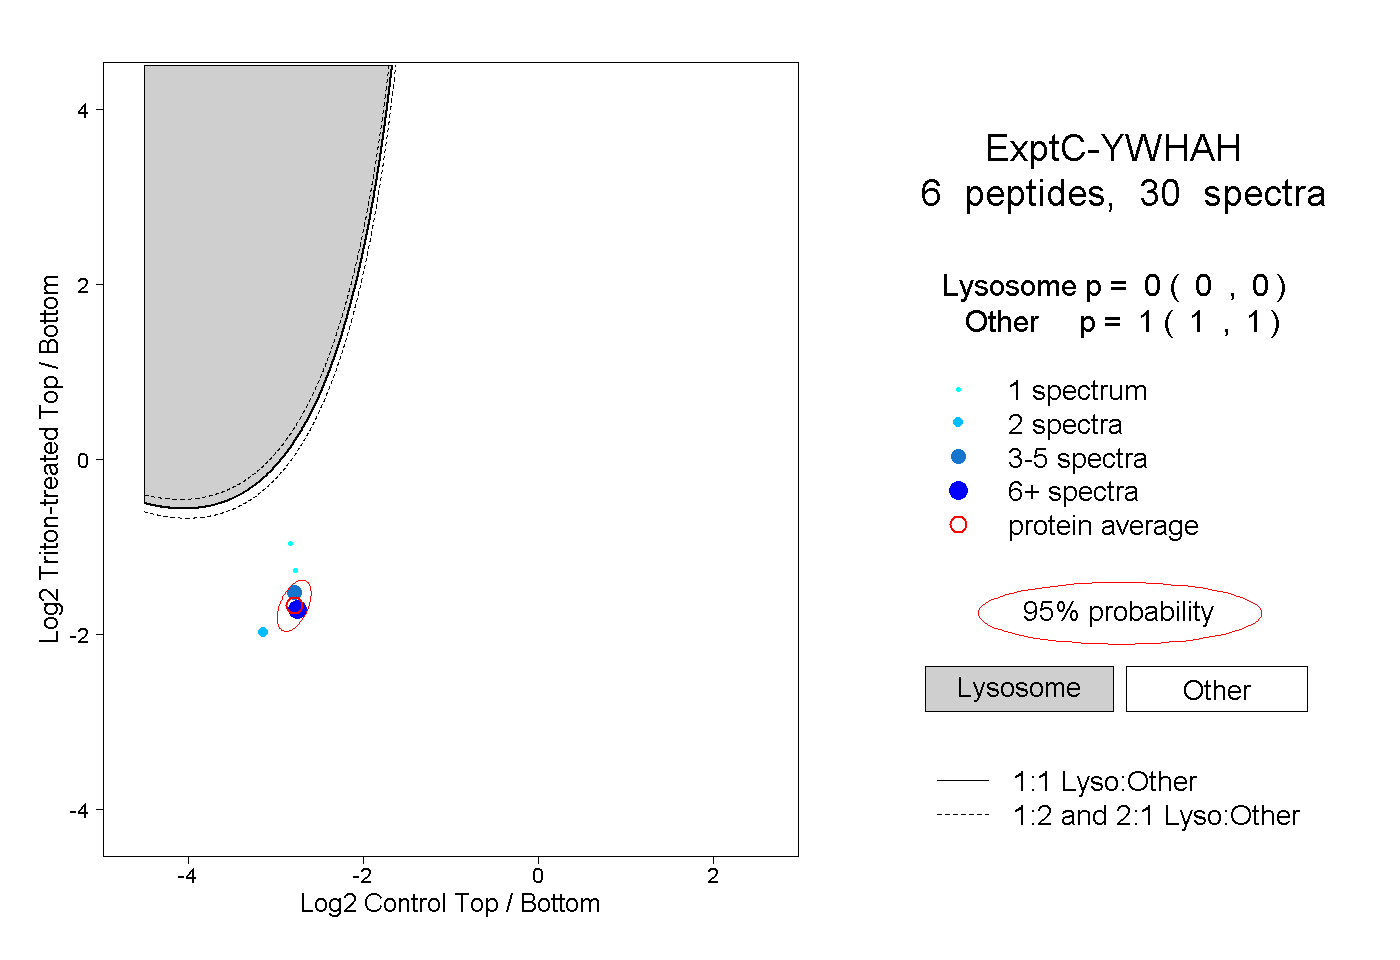
0.000 | 0.000
1.000 | 1.000
1peptide
spectra
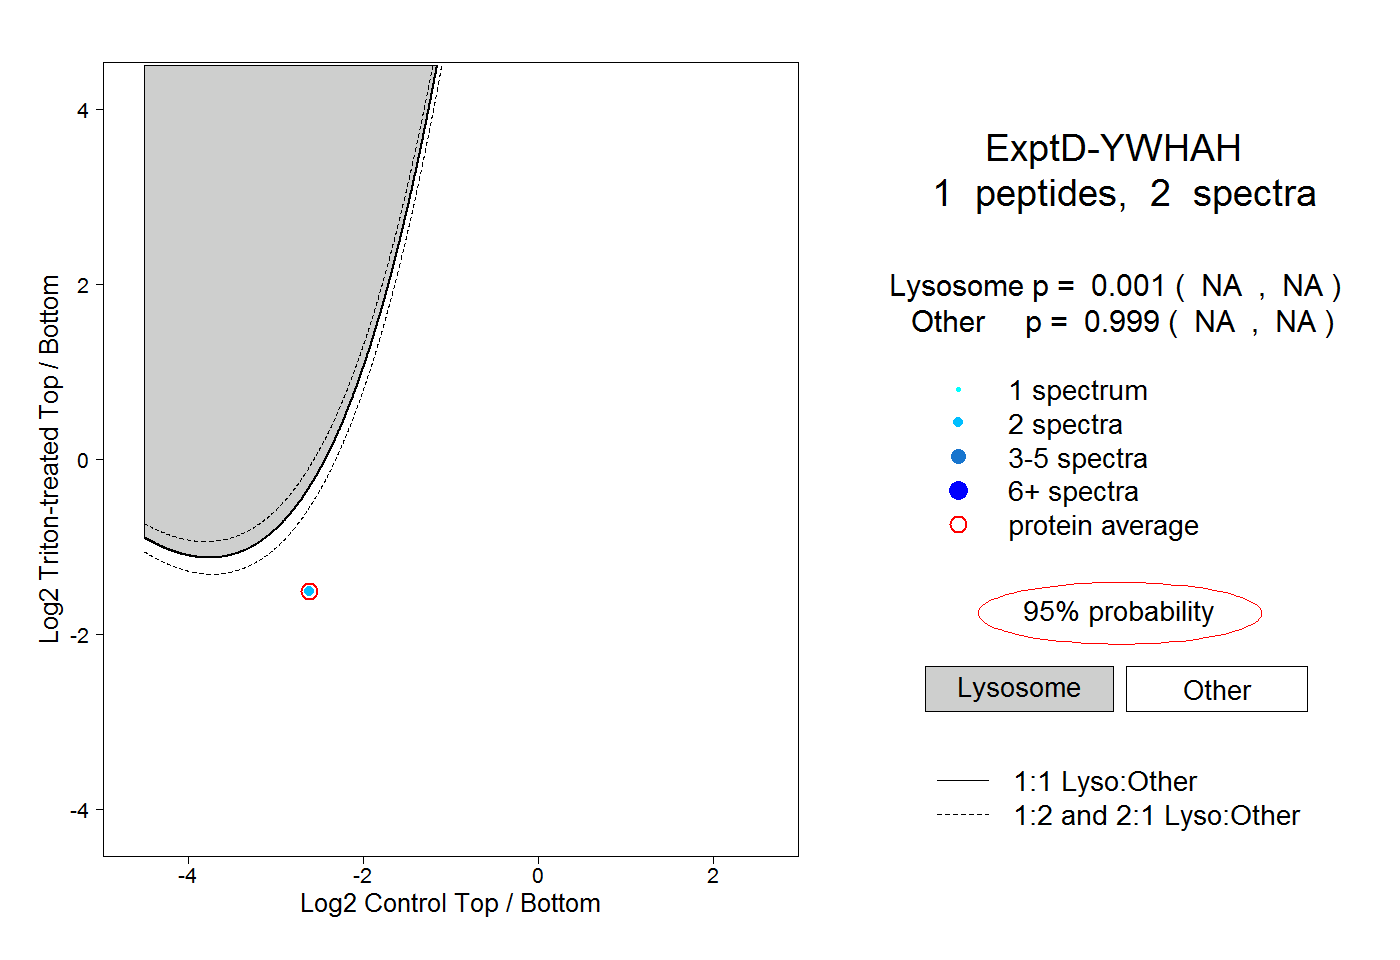
NA | NA
NA | NA