 7
7peptides
spectra
0.000 | 0.002
0.028 | 0.052
0.012 | 0.036
0.000 | 0.000
0.000 | 0.000
0.123 | 0.142
0.793 | 0.805
0.000 | 0.000
| Plot | Mito | Lyso | Perox | ER | Golgi | PM | Cytosol | Nucleus | |||||
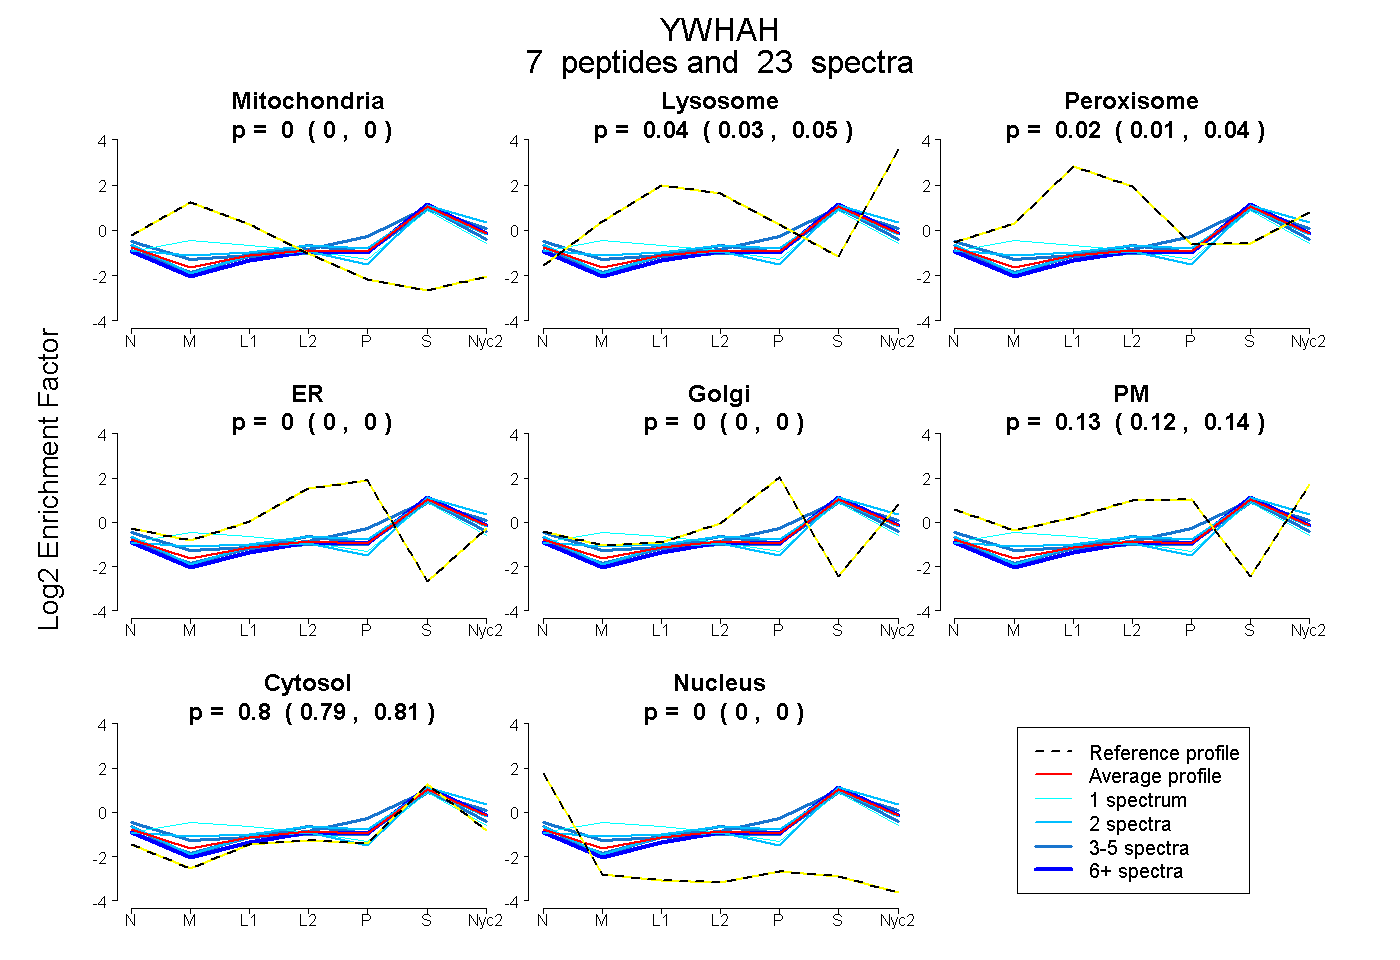
| Expt A |
7 peptides |
23 spectra |
|
0.000 0.000 | 0.002 |
0.041 0.028 | 0.052 |
0.025 0.012 | 0.036 |
0.000 0.000 | 0.000 |
0.000 0.000 | 0.000 |
0.134 0.123 | 0.142 |
0.800 0.793 | 0.805 |
0.000 0.000 | 0.000 |
| 1 spectrum, NSVVEASEAAYK | 0.202 | 0.050 | 0.111 | 0.000 | 0.000 | 0.000 | 0.638 | 0.000 | ||
| 4 spectra, NCNDFQYESK | 0.000 | 0.000 | 0.033 | 0.000 | 0.120 | 0.087 | 0.761 | 0.000 | ||
| 2 spectra, YDDMASAMK | 0.047 | 0.087 | 0.053 | 0.000 | 0.000 | 0.089 | 0.724 | 0.000 | ||
| 4 spectra, EAFEISK | 0.000 | 0.065 | 0.000 | 0.000 | 0.000 | 0.095 | 0.840 | 0.000 | ||
| 3 spectra, AVTELNEPLSNEDR | 0.014 | 0.043 | 0.035 | 0.000 | 0.000 | 0.184 | 0.723 | 0.000 | ||
| 2 spectra, YLAEVASGEK | 0.000 | 0.160 | 0.000 | 0.000 | 0.000 | 0.015 | 0.797 | 0.028 | ||
| 7 spectra, TMADGNEK | 0.000 | 0.040 | 0.000 | 0.000 | 0.000 | 0.107 | 0.853 | 0.000 |
| Plot | Mito | Lyso or Perox | ER | Golgi | PM | Cytosol | Nucleus | ||||||
| Expt B |
2 peptides |
3 spectra |
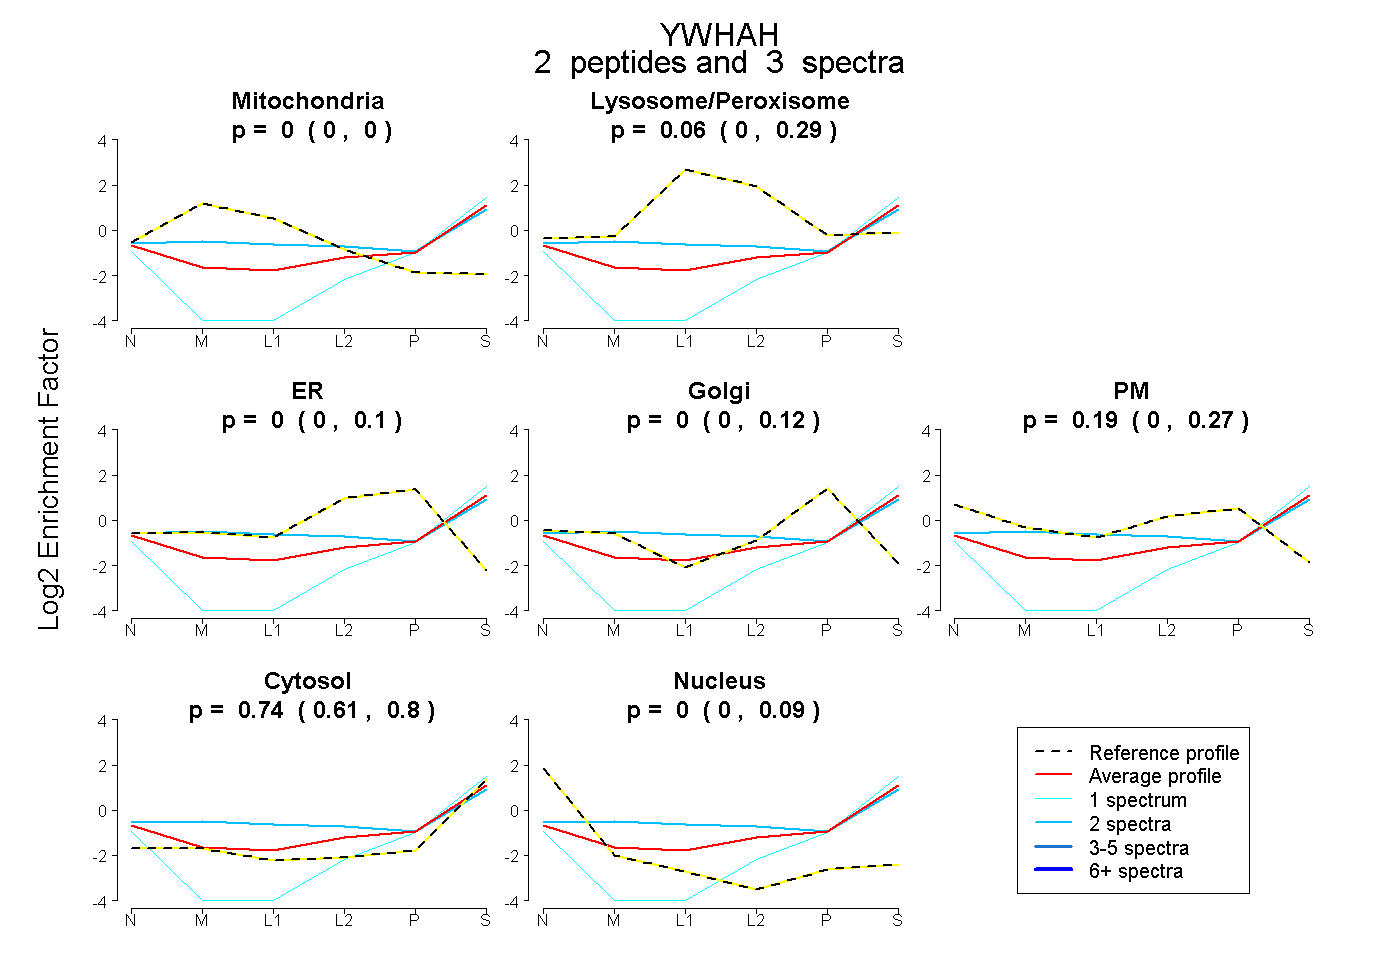 |
0.000 0.000 | 0.000 |
0.063 0.000 | 0.286 |
0.000 0.000 | 0.098 |
0.000 0.000 | 0.116 |
0.195 0.000 | 0.266 |
0.743 0.612 | 0.799 |
0.000 0.000 | 0.086 |
|||
| Plot | Lyso | Other | |||||||||||
| Expt C |
6 peptides |
30 spectra |
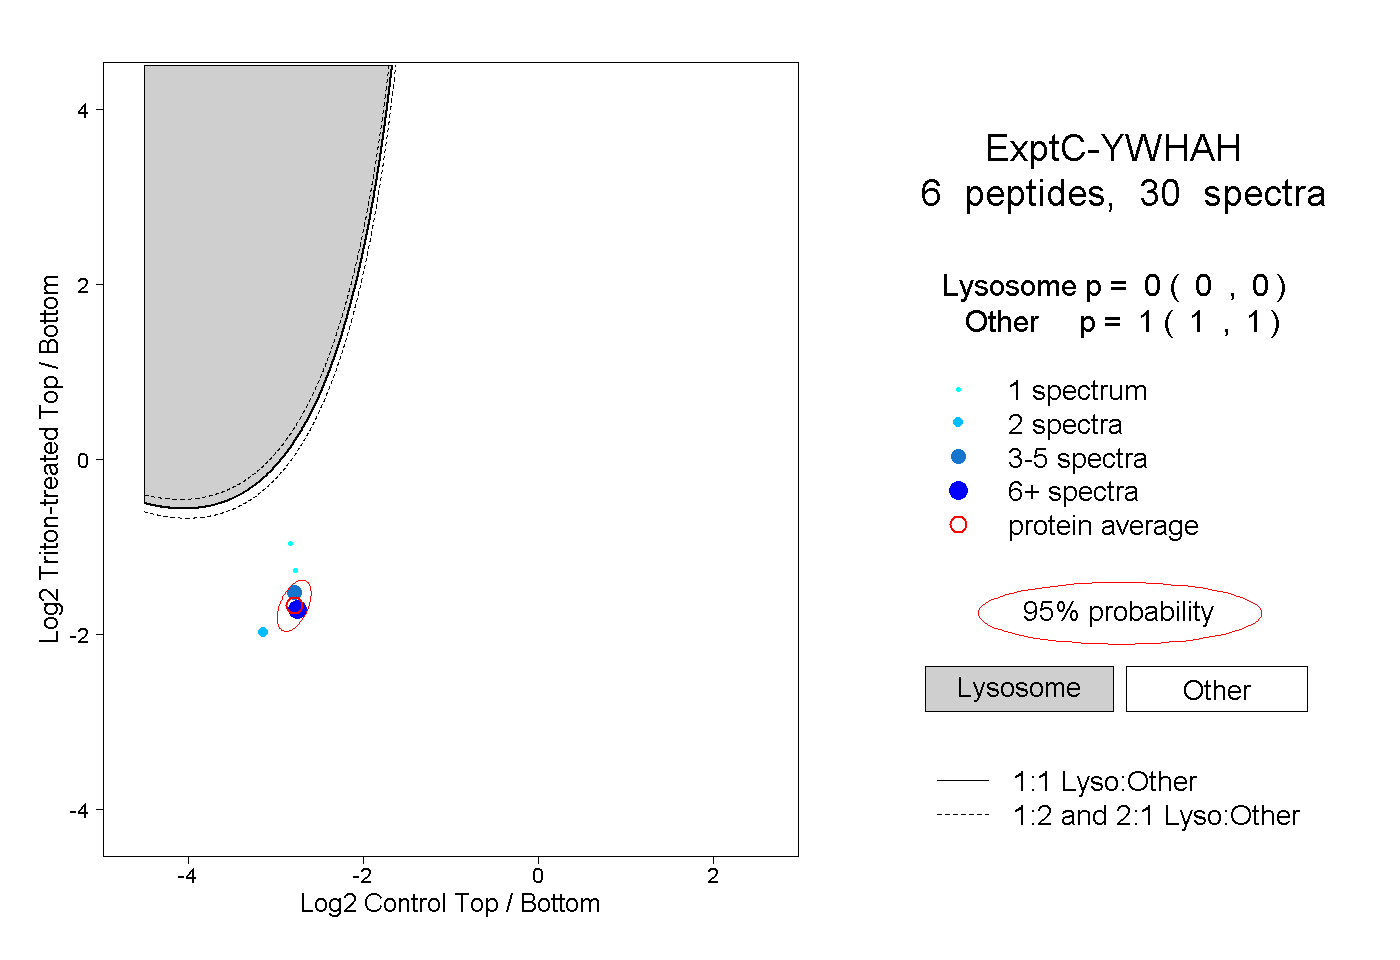 |
0.000 0.000 | 0.000 |
1.000 1.000 | 1.000 |
||||||||
| Plot | Lyso | Other | |||||||||||
| Expt D |
1 peptide |
2 spectra |
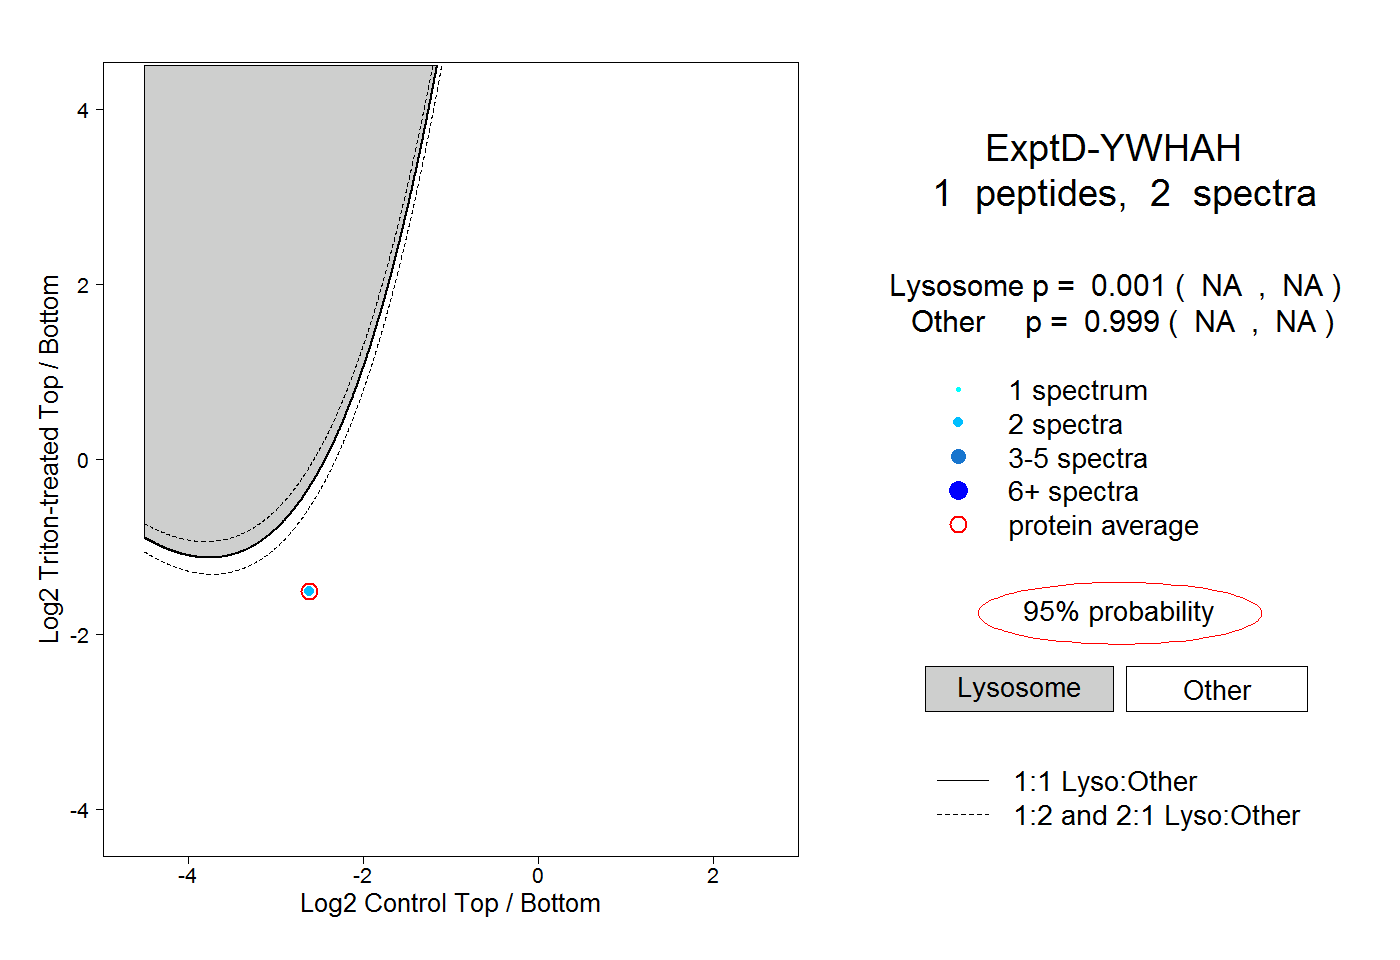 |
0.001 NA | NA |
0.999 NA | NA |