 10
10peptides
spectra
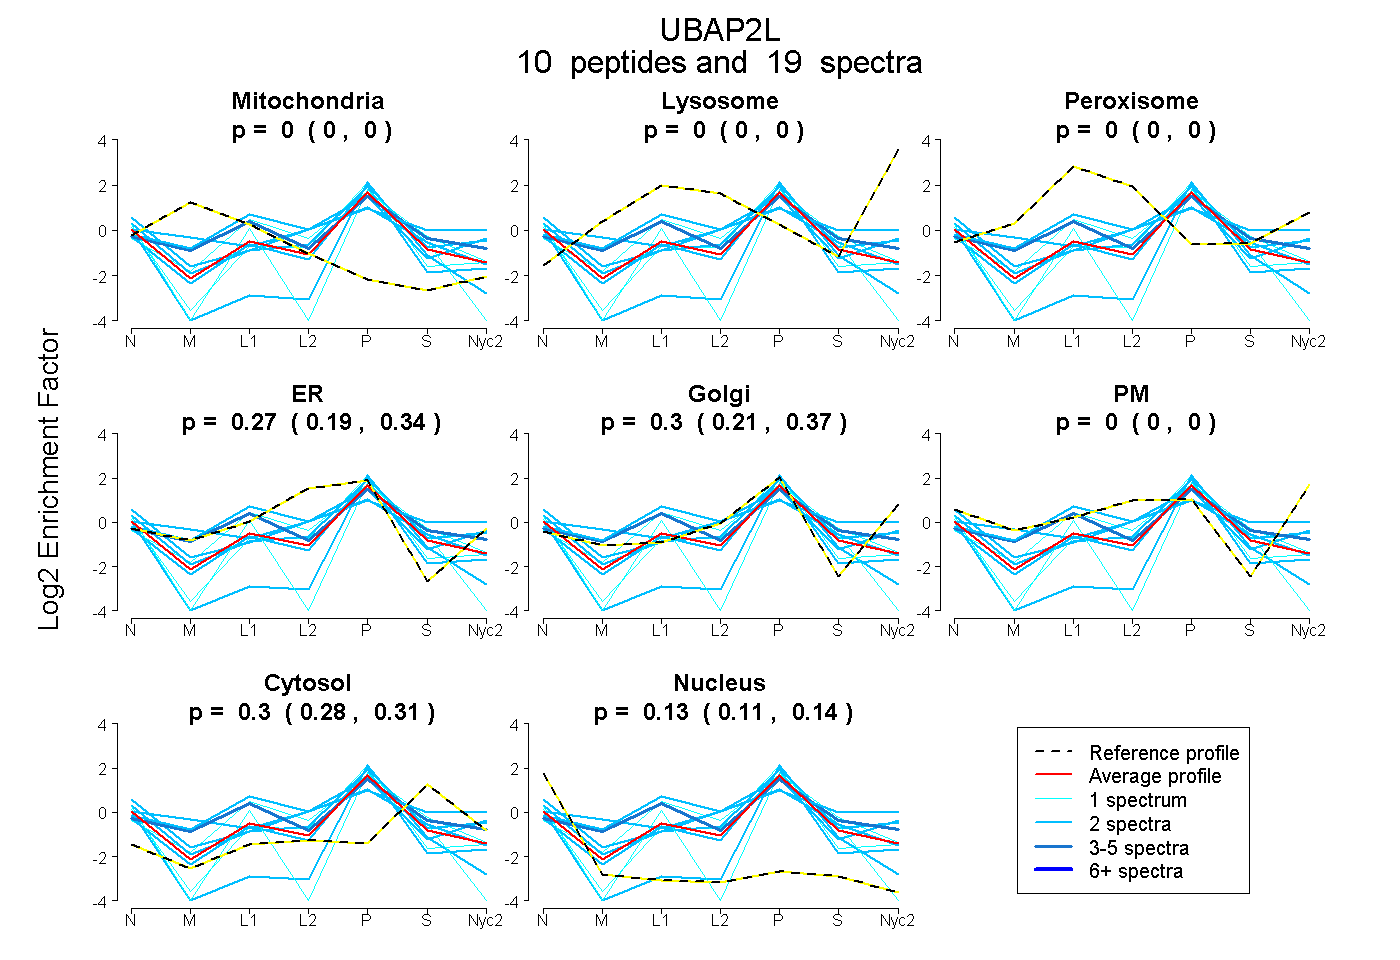
0.000 | 0.000
0.000 | 0.000
0.000 | 0.000
0.194 | 0.340
0.215 | 0.368
0.000 | 0.000
0.282 | 0.315
0.109 | 0.144
3peptides
spectra
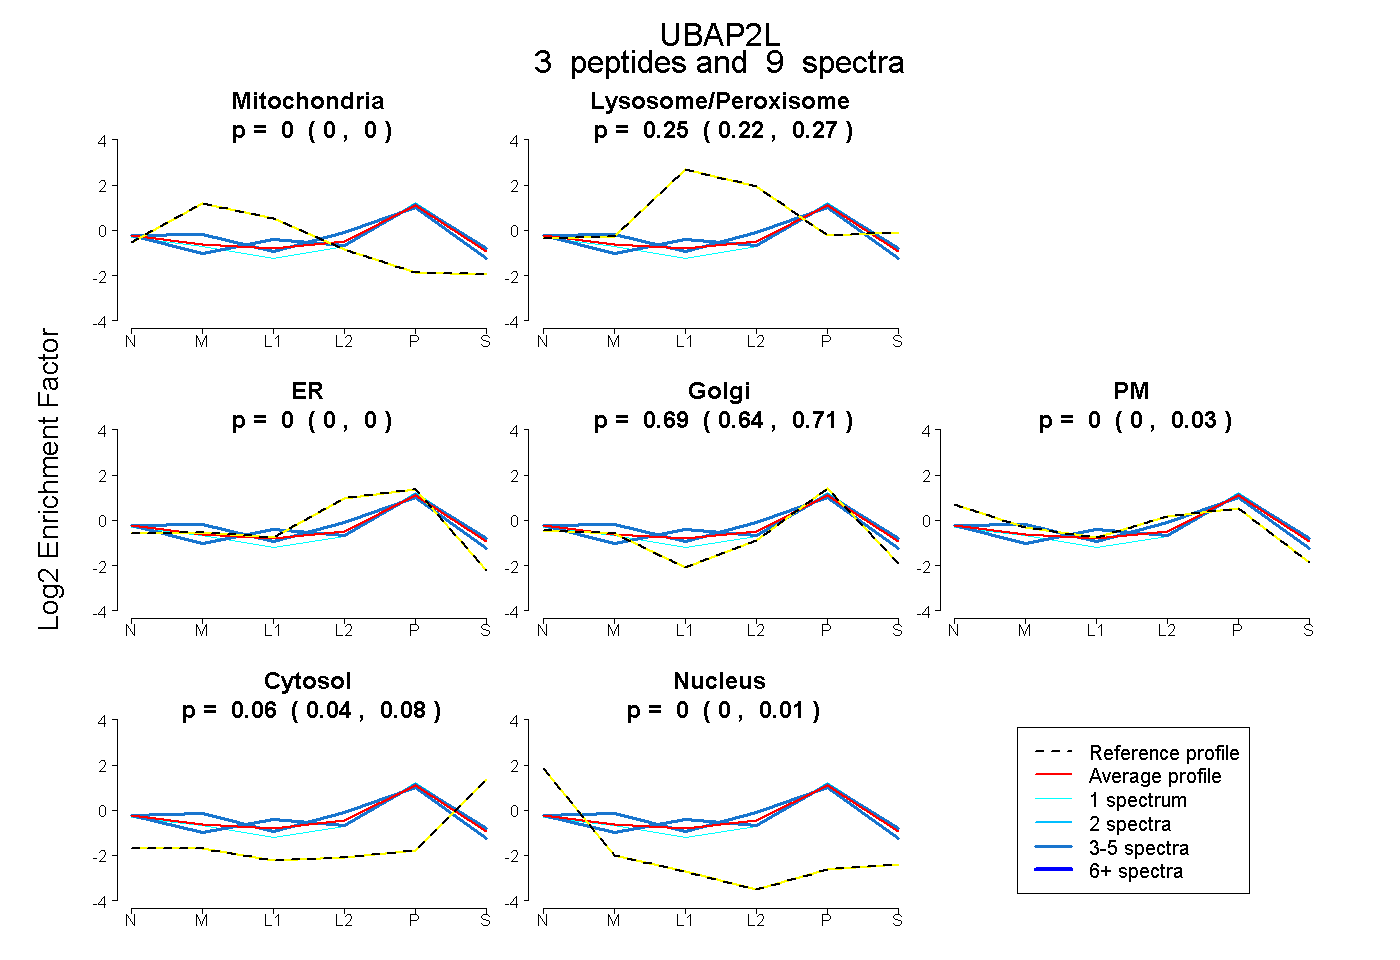
0.000 | 0.000
0.218 | 0.268
0.000 | 0.000
0.644 | 0.712
0.000 | 0.032
0.038 | 0.085
0.000 | 0.008
9peptides
spectra
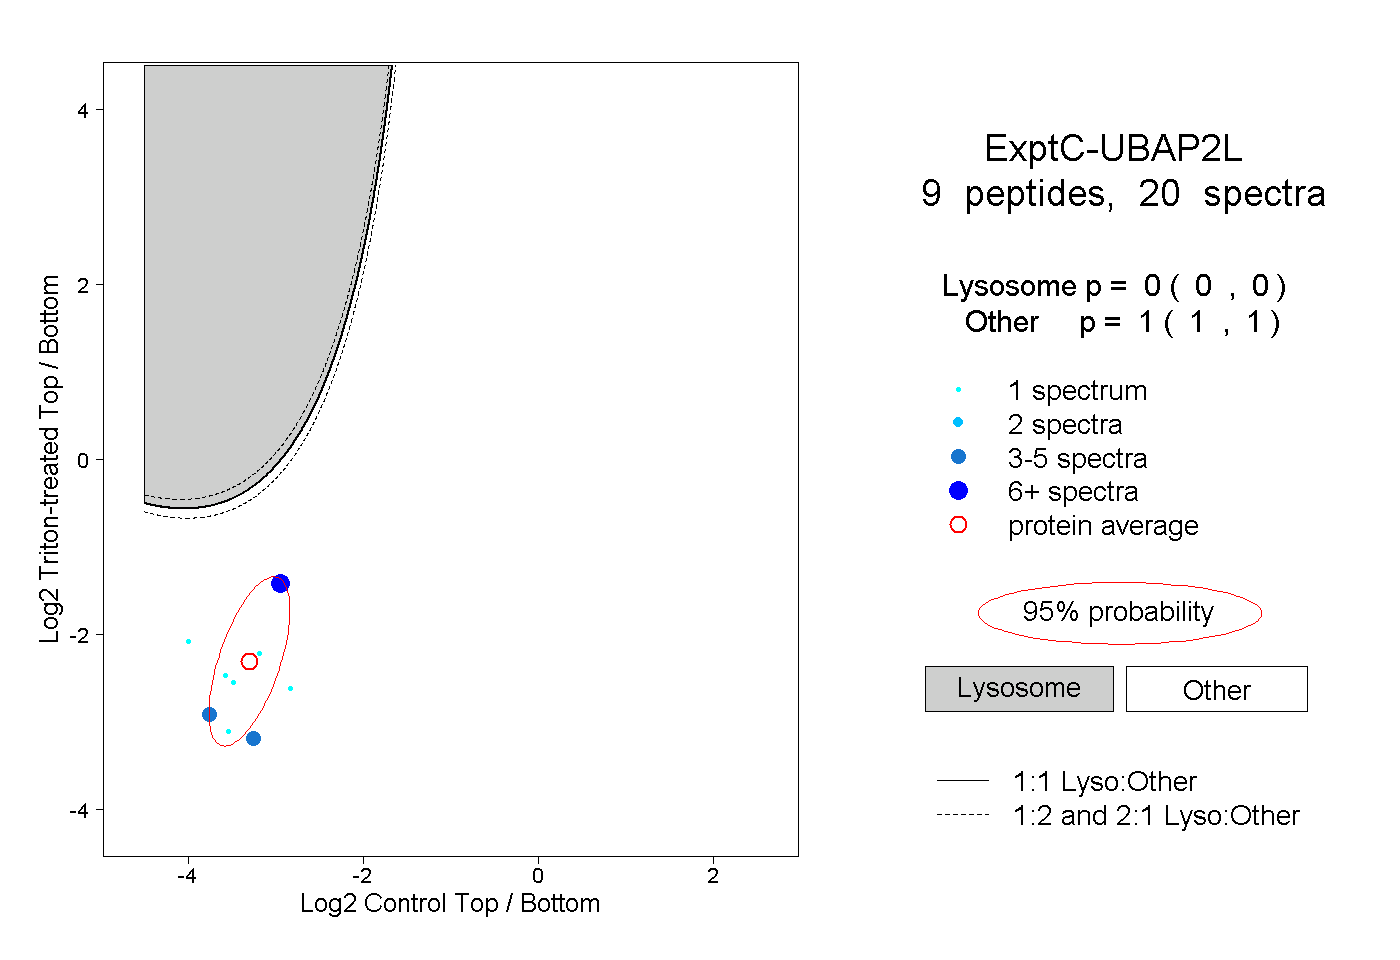
0.000 | 0.000
1.000 | 1.000