 10
10peptides
spectra
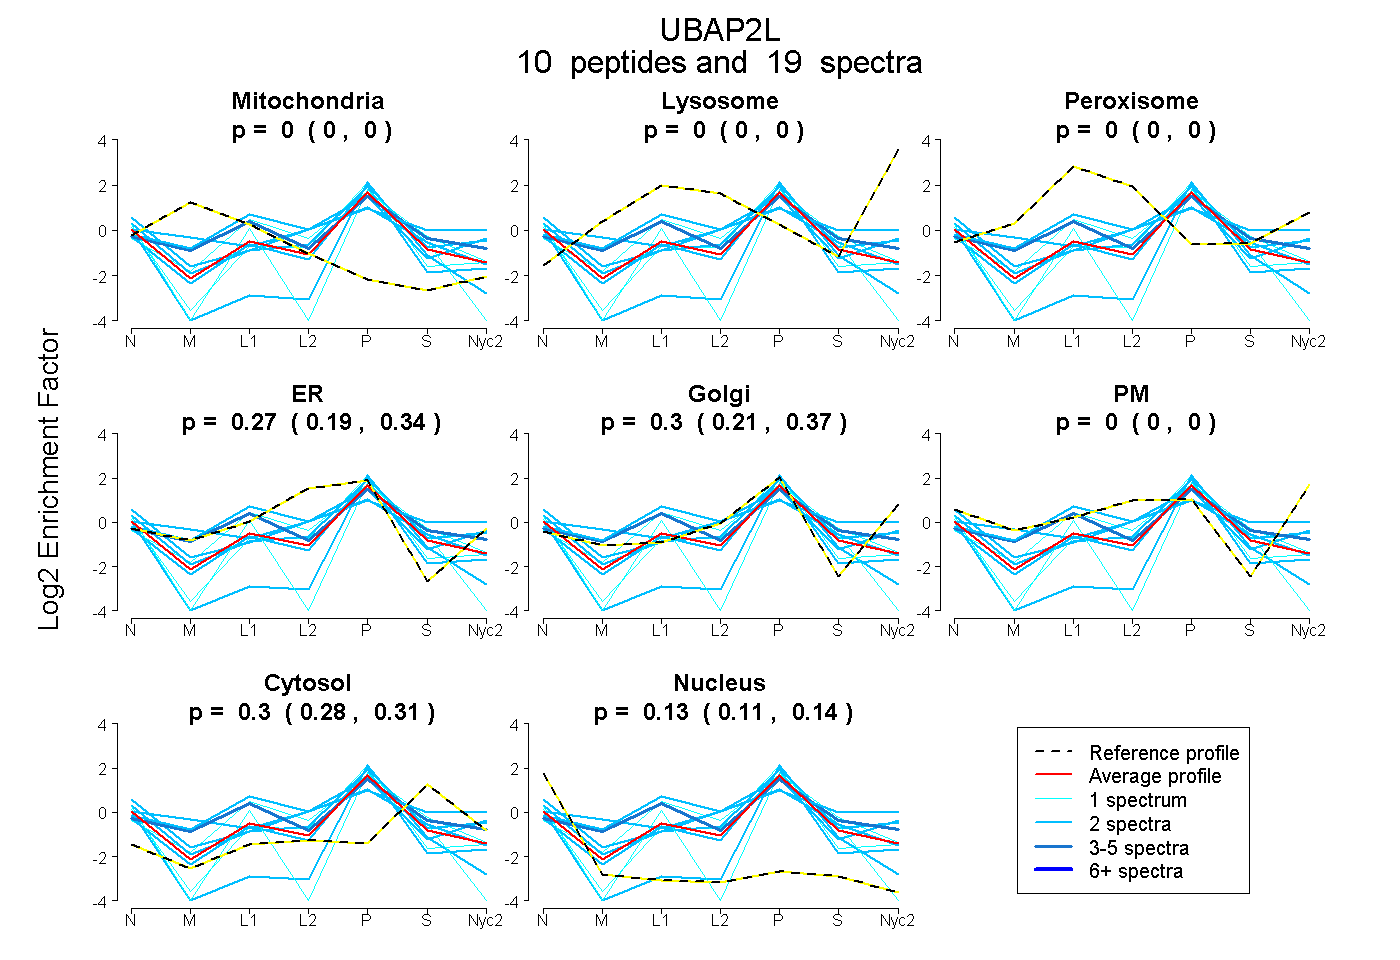
0.000 | 0.000
0.000 | 0.000
0.000 | 0.000
0.194 | 0.340
0.215 | 0.368
0.000 | 0.000
0.282 | 0.315
0.109 | 0.144
| Plot | Mito | Lyso | Perox | ER | Golgi | PM | Cytosol | Nucleus | |||||
| Expt A |
10 peptides |
19 spectra |
|
0.000 0.000 | 0.000 |
0.000 0.000 | 0.000 |
0.000 0.000 | 0.000 |
0.274 0.194 | 0.340 |
0.297 0.215 | 0.368 |
0.000 0.000 | 0.000 |
0.300 0.282 | 0.315 |
0.129 0.109 | 0.144 |
| 2 spectra, TQQSFEK | 0.000 | 0.000 | 0.372 | 0.019 | 0.345 | 0.000 | 0.264 | 0.000 | ||
| 1 spectrum, AINVLLEGNPDTHSWEMVGK | 0.000 | 0.000 | 0.000 | 0.285 | 0.353 | 0.000 | 0.167 | 0.194 | ||
| 4 spectra, SSVATTSGK | 0.048 | 0.000 | 0.132 | 0.164 | 0.349 | 0.000 | 0.306 | 0.000 | ||
| 2 spectra, IDLAVLLGK | 0.000 | 0.000 | 0.000 | 0.000 | 0.339 | 0.000 | 0.206 | 0.455 | ||
| 1 spectrum, LAQMISDHNDADFEEK | 0.000 | 0.000 | 0.000 | 0.017 | 0.184 | 0.000 | 0.347 | 0.453 | ||
| 2 spectra, GQENGLDGTK | 0.000 | 0.000 | 0.000 | 0.430 | 0.272 | 0.000 | 0.064 | 0.234 | ||
| 2 spectra, QRPQATAEQIR | 0.142 | 0.000 | 0.000 | 0.527 | 0.000 | 0.000 | 0.315 | 0.016 | ||
| 2 spectra, GGSTTGSQFLEQFK | 0.000 | 0.000 | 0.000 | 0.000 | 0.643 | 0.000 | 0.326 | 0.032 | ||
| 1 spectrum, DGSLASNPYSGDLTK | 0.000 | 0.000 | 0.000 | 0.577 | 0.000 | 0.000 | 0.423 | 0.000 | ||
| 2 spectra, GVSGQK | 0.000 | 0.000 | 0.000 | 0.334 | 0.368 | 0.029 | 0.182 | 0.088 |
| Plot | Mito | Lyso or Perox | ER | Golgi | PM | Cytosol | Nucleus | ||||||
| Expt B |
3 peptides |
9 spectra |
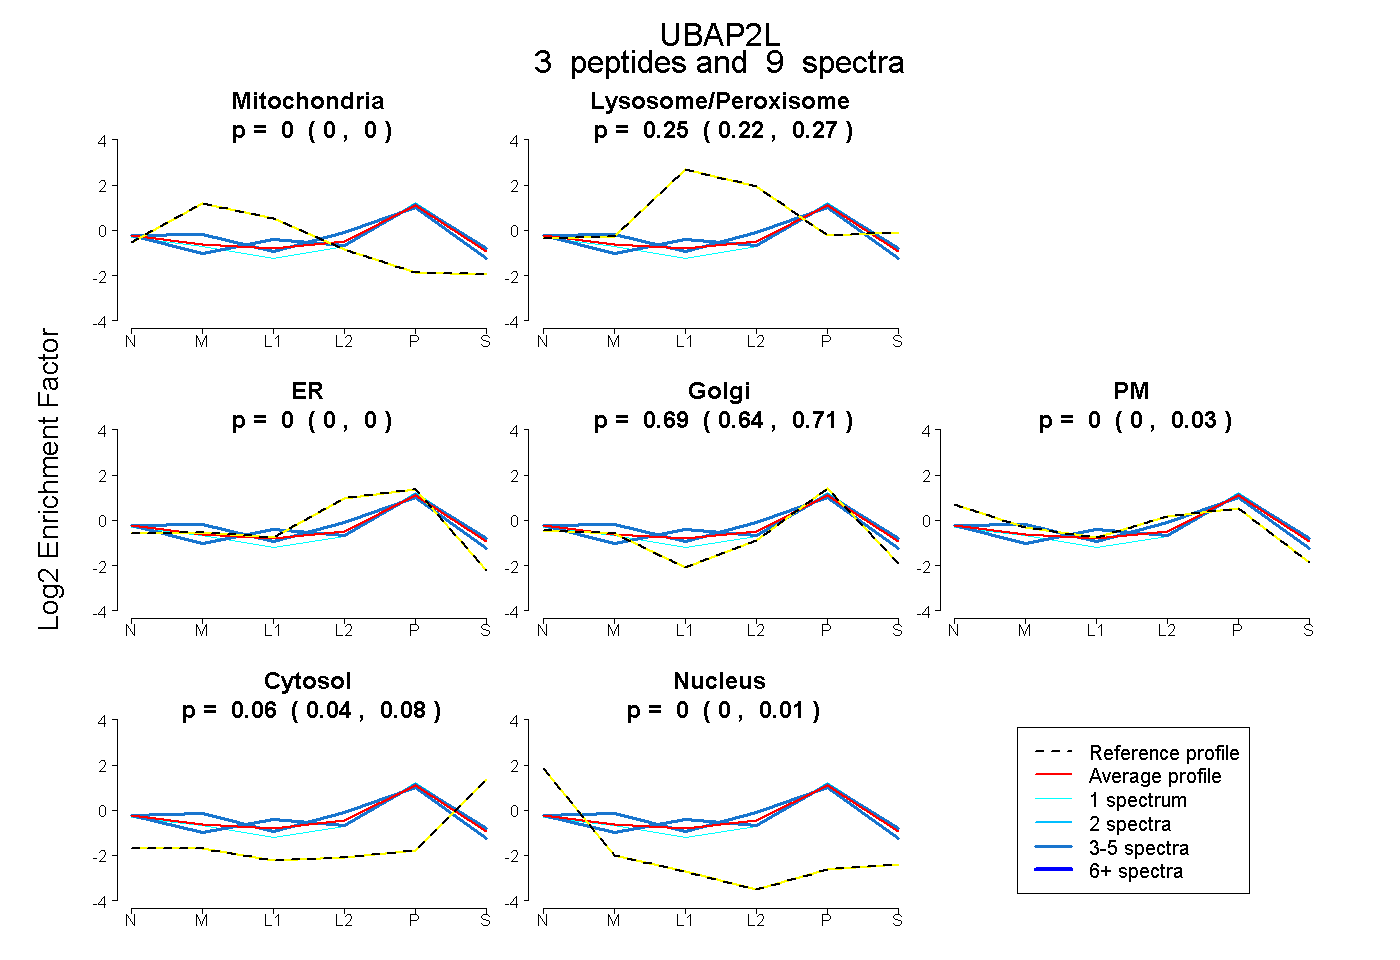 |
0.000 0.000 | 0.000 |
0.247 0.218 | 0.268 |
0.000 0.000 | 0.000 |
0.689 0.644 | 0.712 |
0.000 0.000 | 0.032 |
0.064 0.038 | 0.085 |
0.000 0.000 | 0.008 |
|||
| Plot | Lyso | Other | |||||||||||
| Expt C |
9 peptides |
20 spectra |
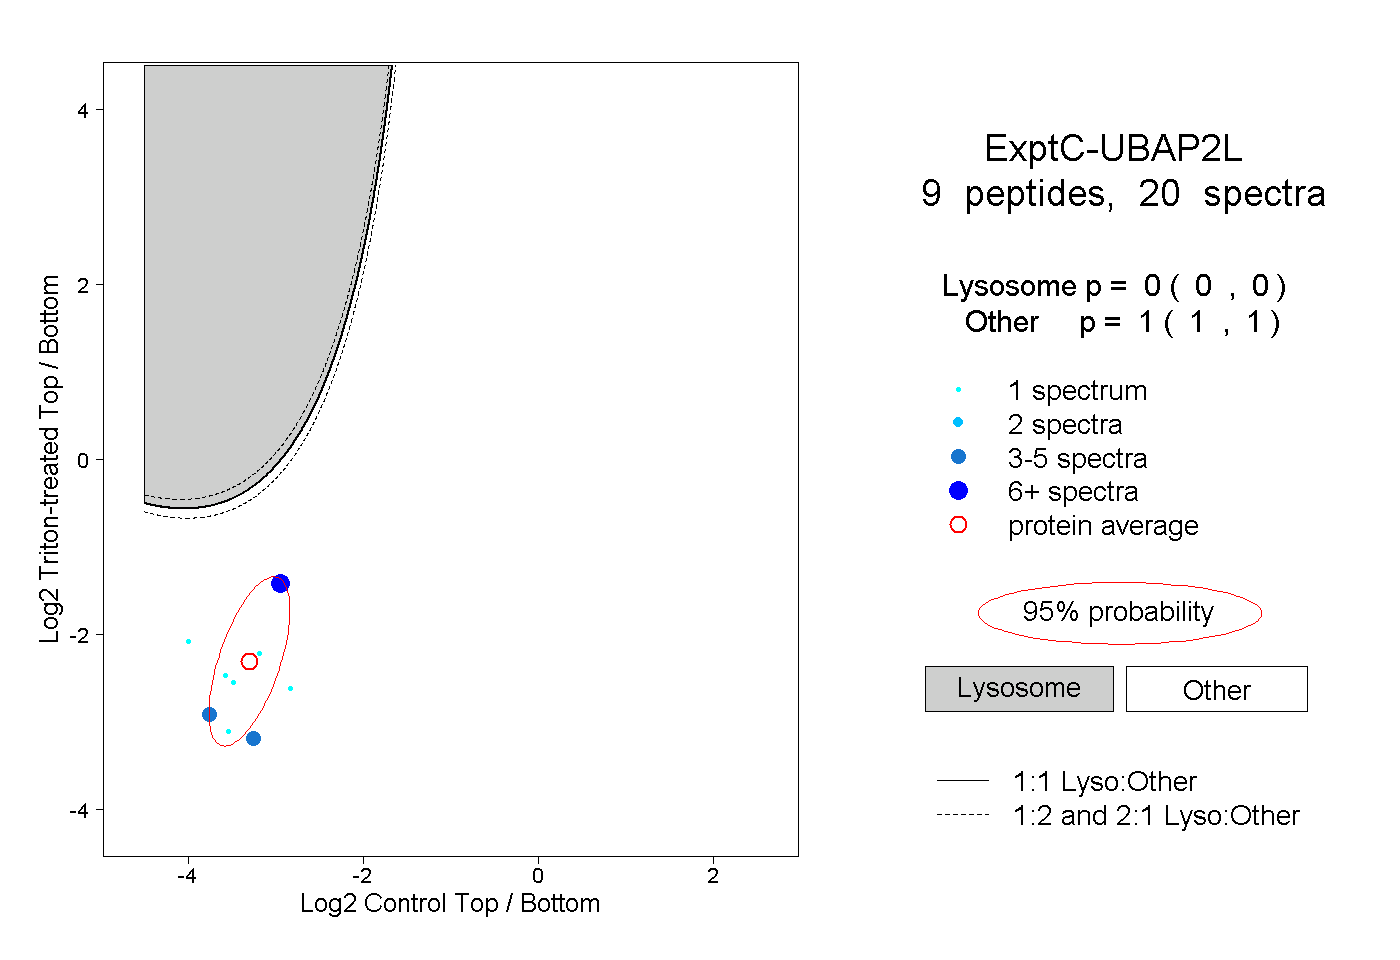 |
0.000 0.000 | 0.000 |
1.000 1.000 | 1.000 |