 36
36peptides
spectra
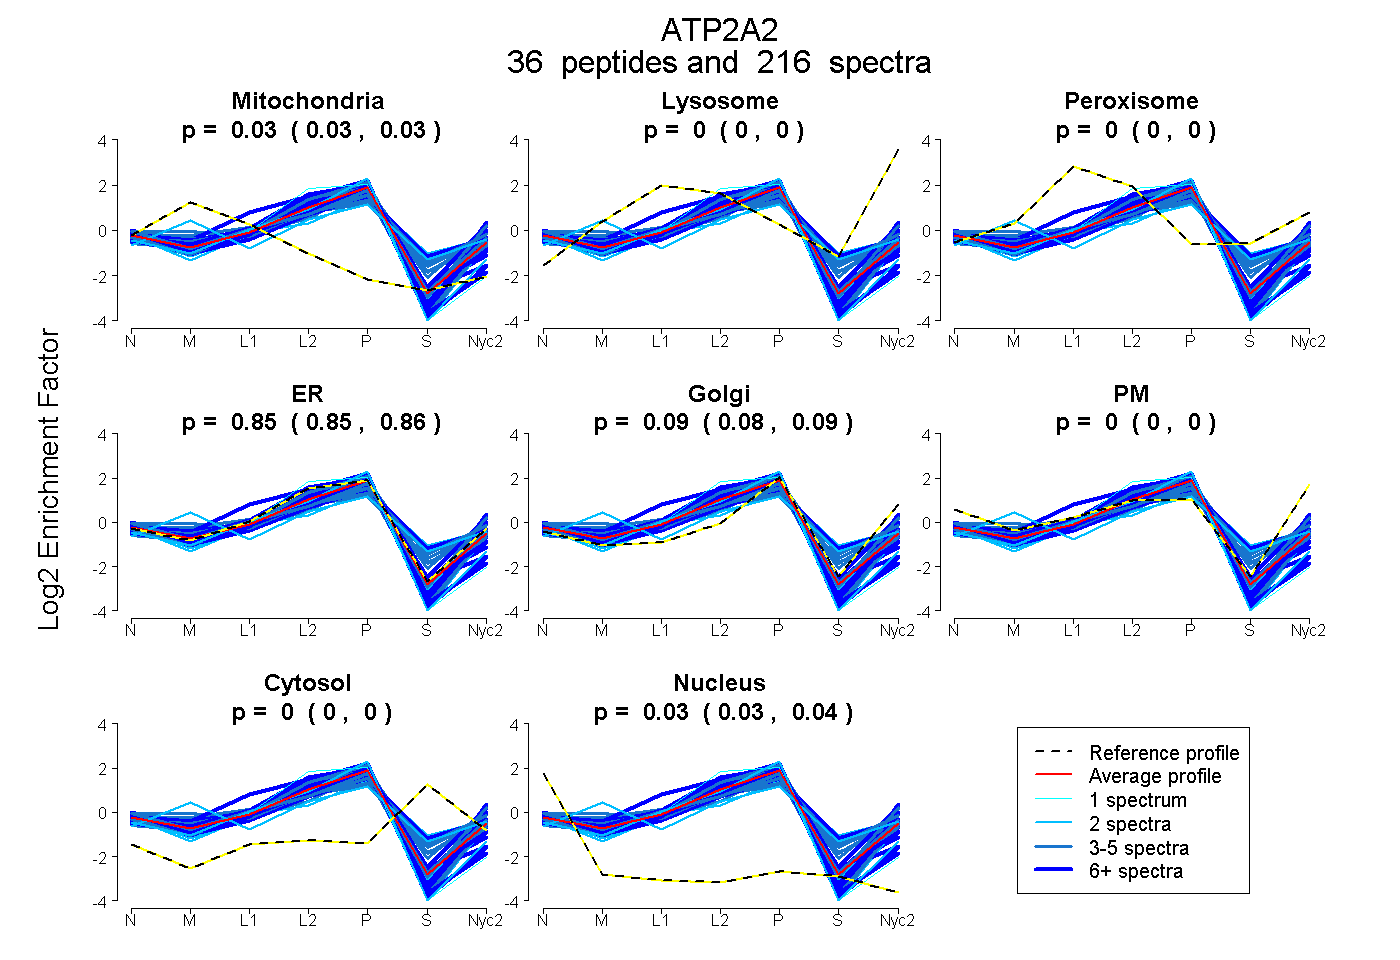
0.026 | 0.028
0.000 | 0.000
0.000 | 0.000
0.849 | 0.857
0.080 | 0.089
0.000 | 0.000
0.000 | 0.000
0.033 | 0.035
24peptides
spectra
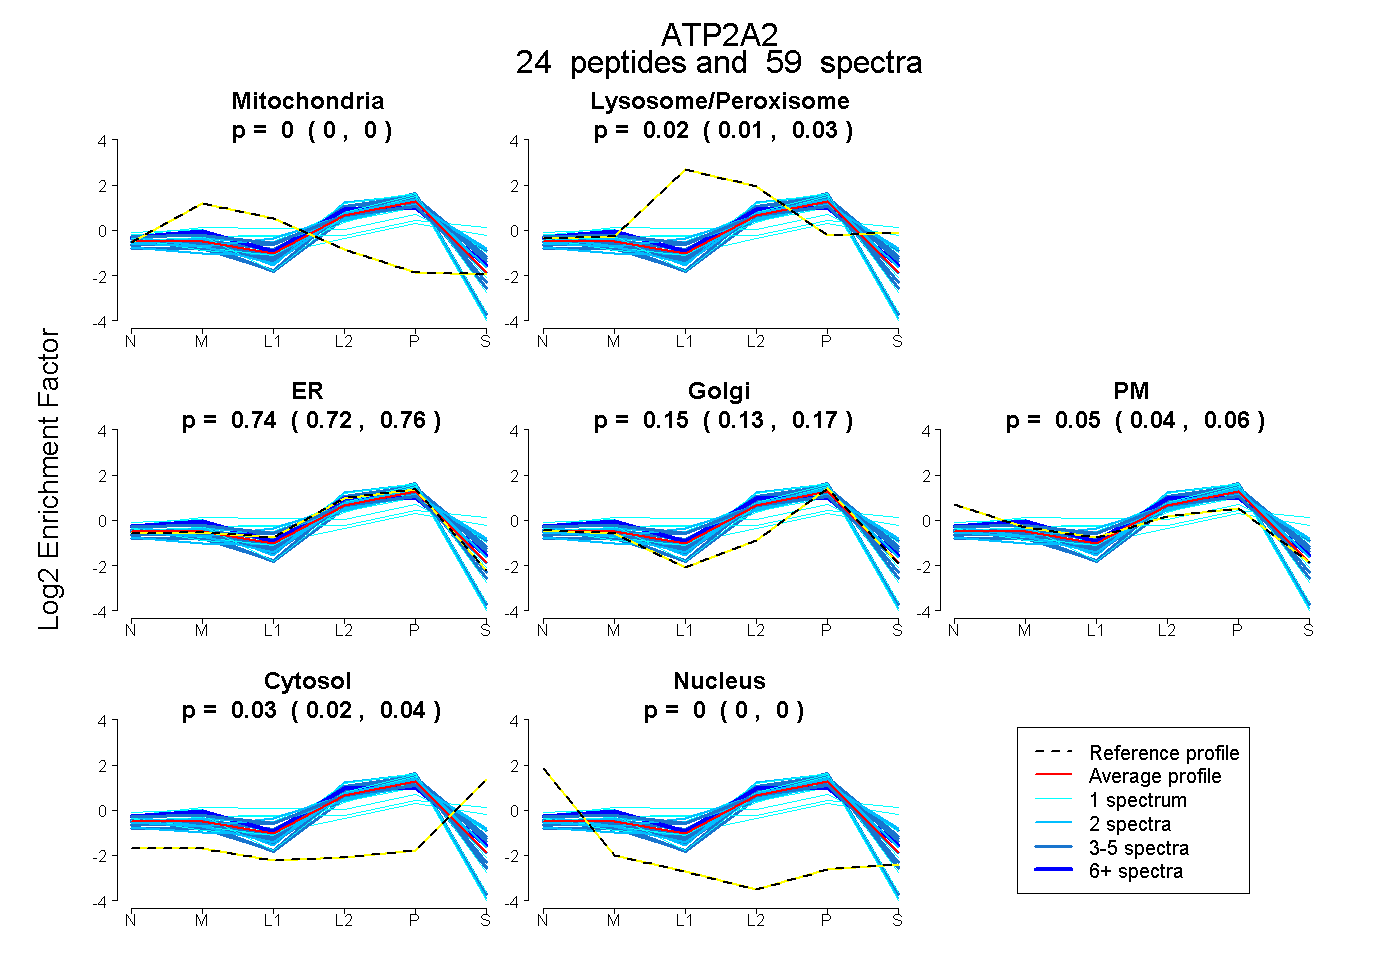
0.000 | 0.000
0.007 | 0.033
0.721 | 0.765
0.127 | 0.174
0.037 | 0.063
0.024 | 0.036
0.000 | 0.000
35peptides
spectra
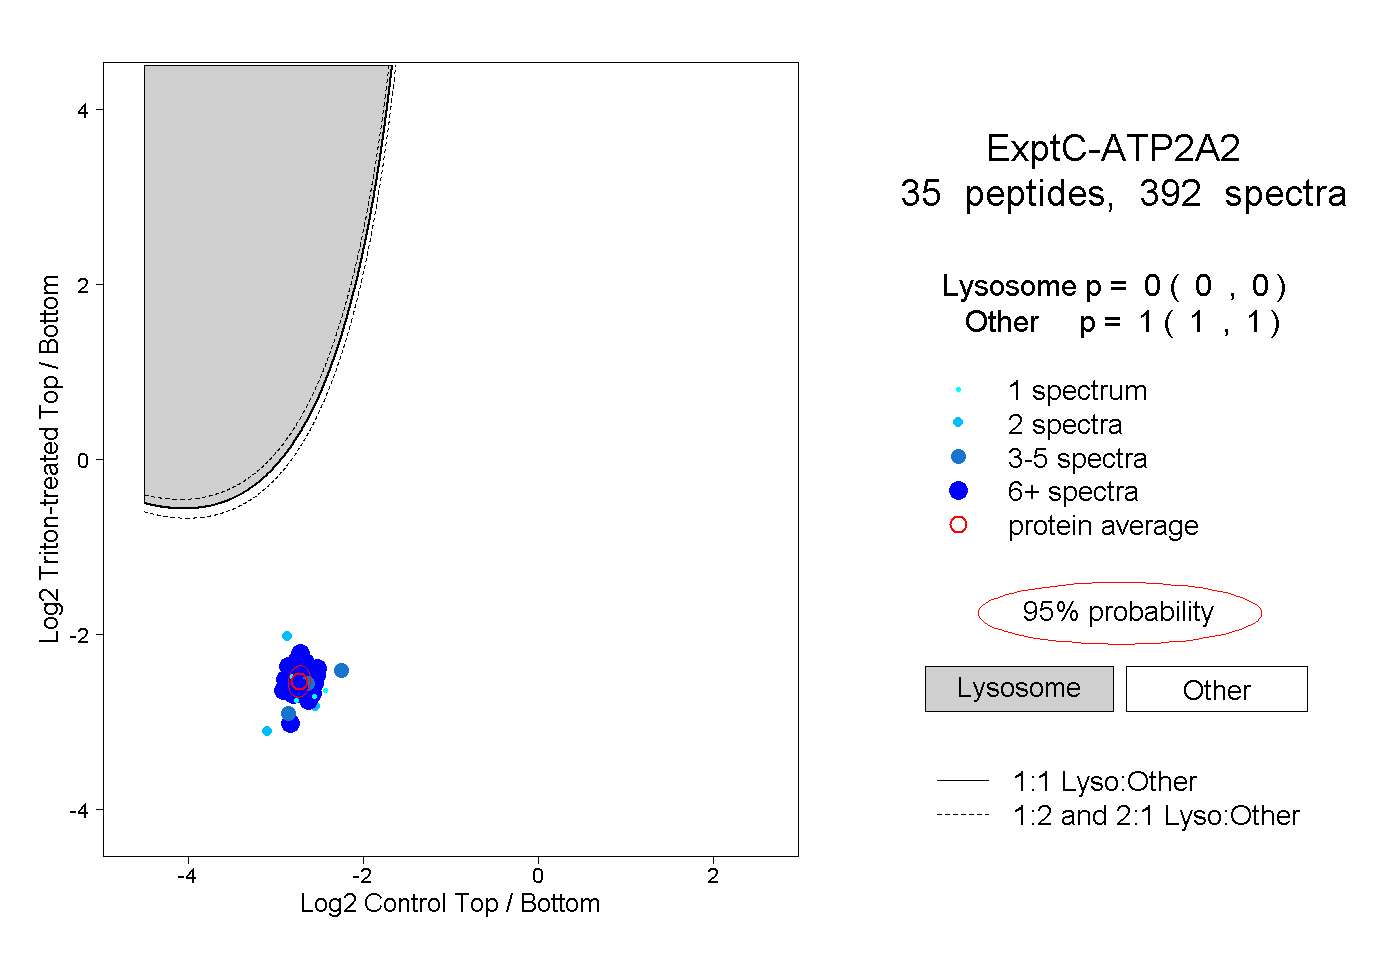
0.000 | 0.000
1.000 | 1.000
13peptides
spectra
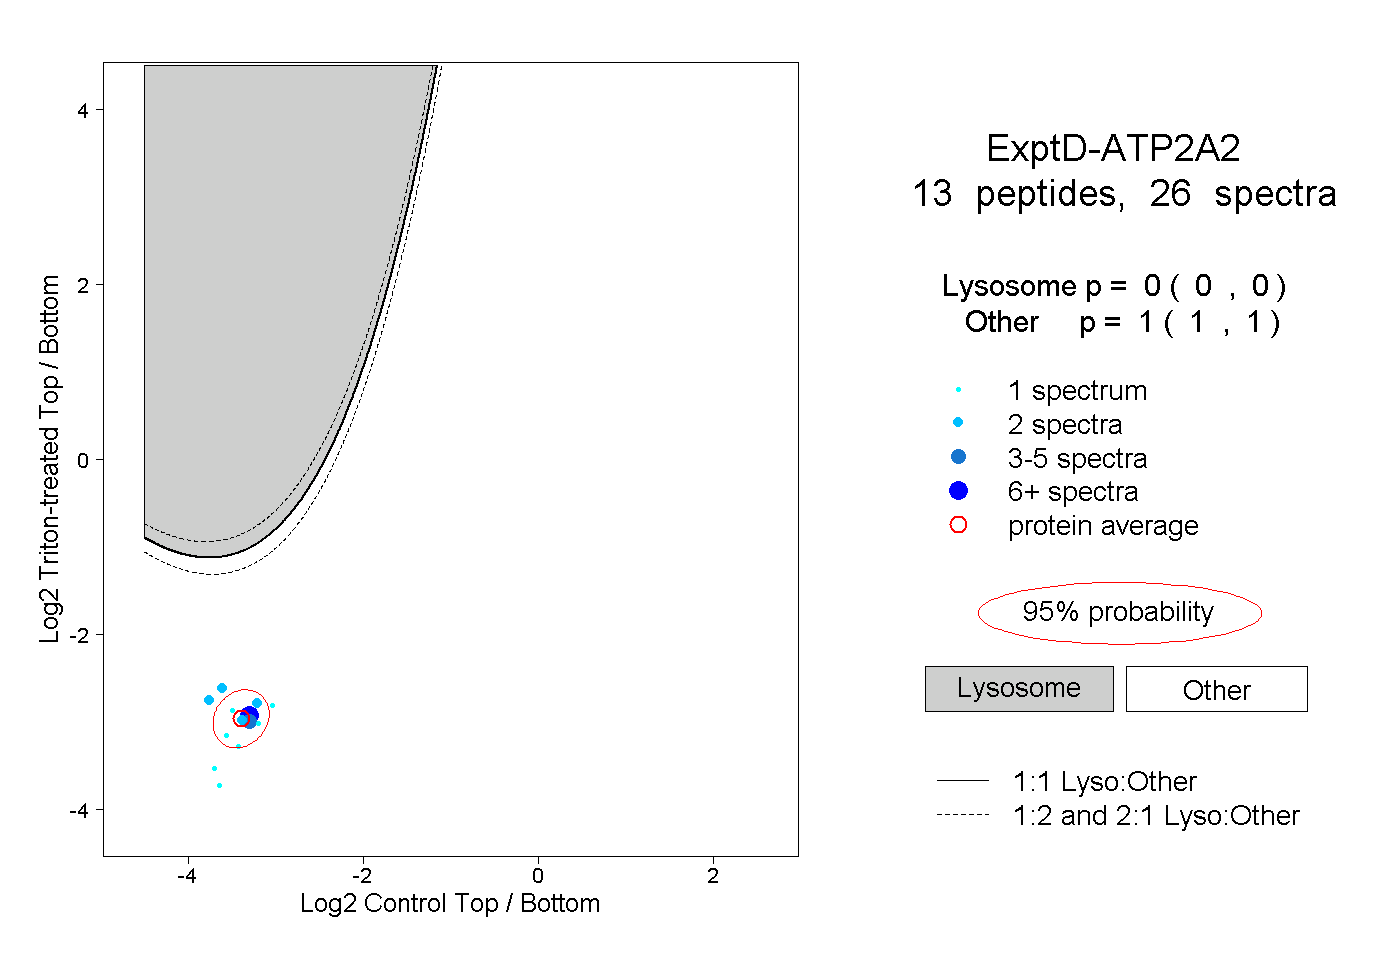
0.000 | 0.000
1.000 | 1.000