 10
10peptides
spectra
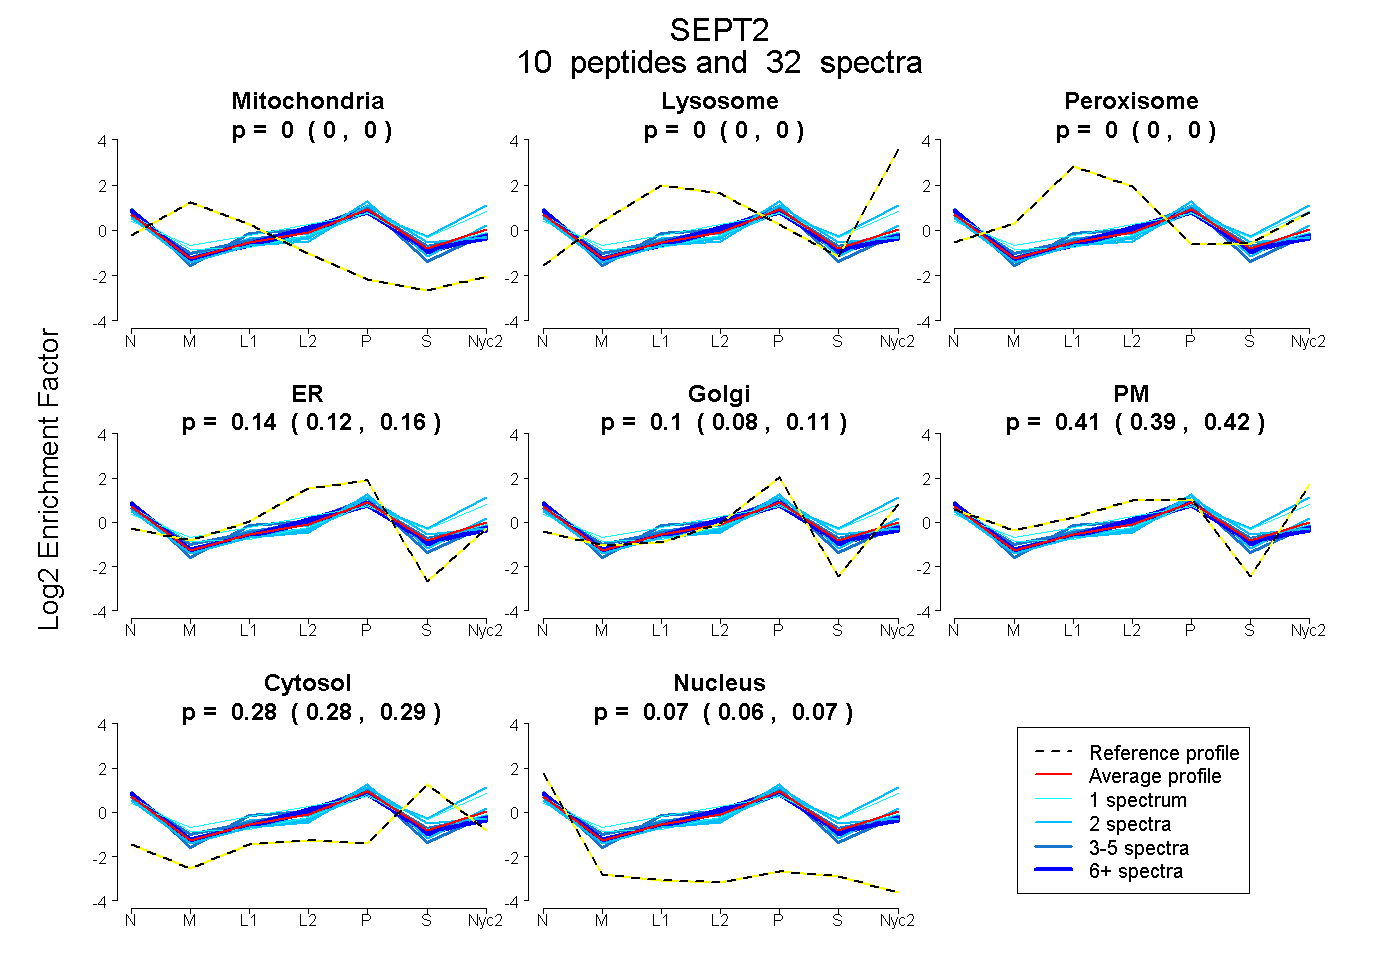
0.000 | 0.000
0.000 | 0.000
0.000 | 0.000
0.124 | 0.161
0.083 | 0.111
0.392 | 0.420
0.276 | 0.289
0.062 | 0.071
2peptides
spectra
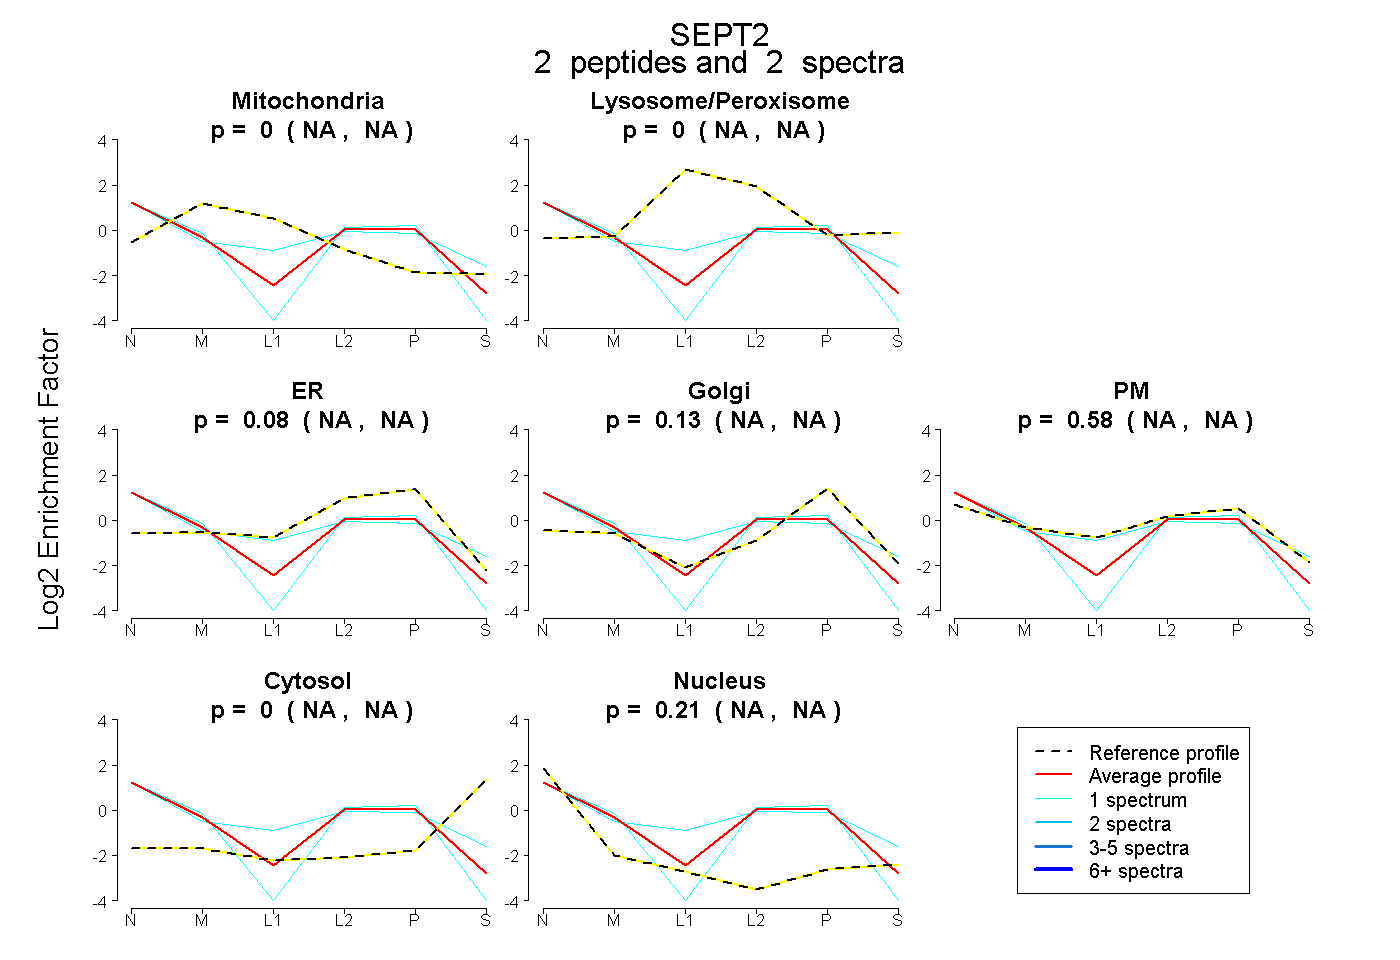
NA | NA
NA | NA
NA | NA
NA | NA
NA | NA
NA | NA
NA | NA
8peptides
spectra

0.000 | 0.000
1.000 | 1.000
6peptides
spectra

0.000 | 0.000
1.000 | 1.000