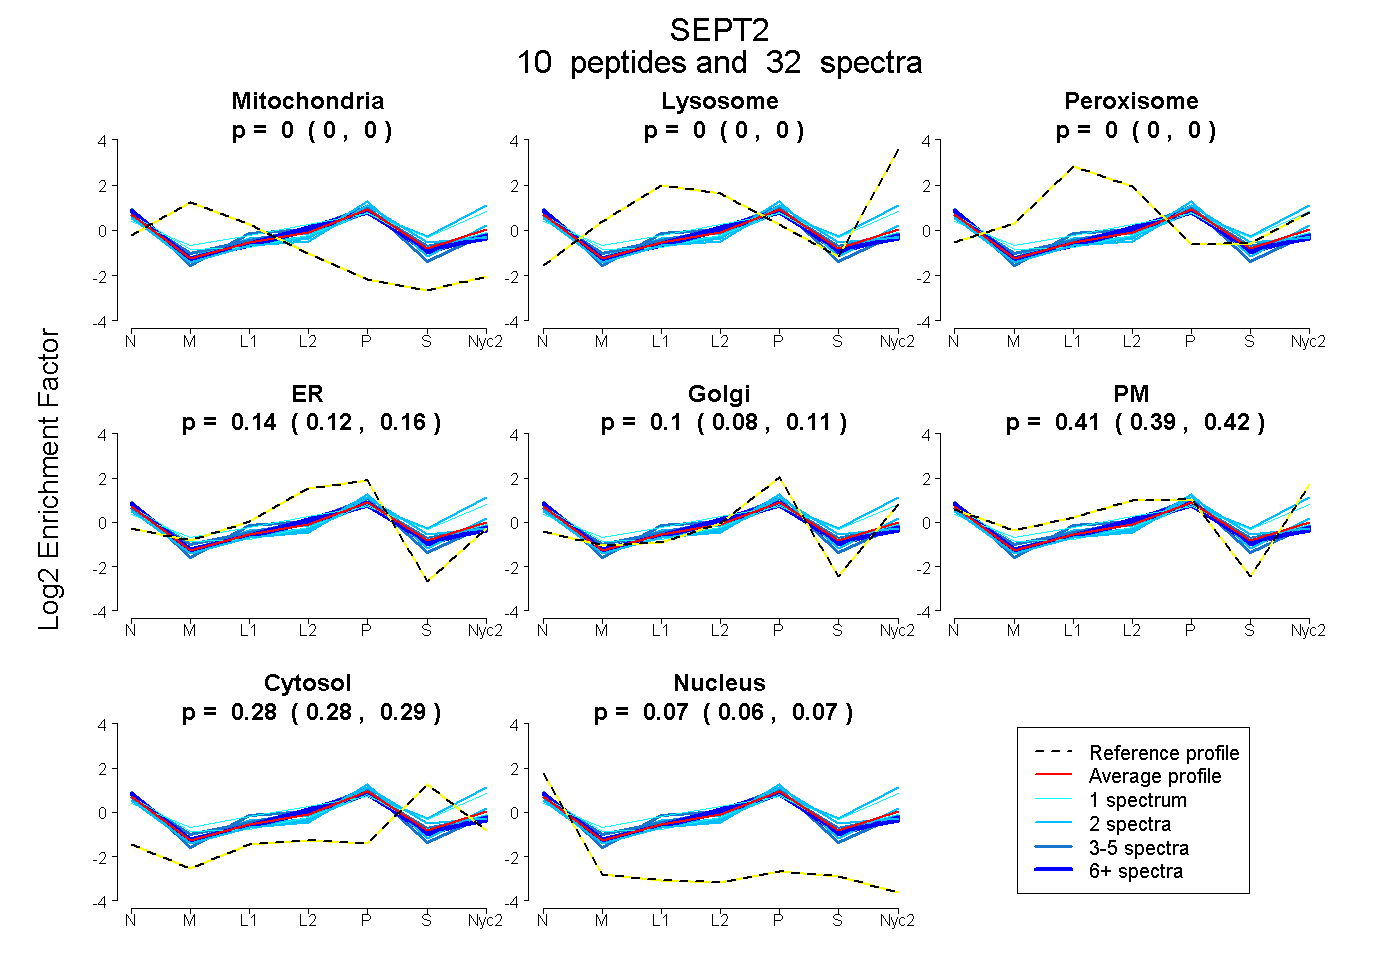
 10
10peptides
spectra
0.000 | 0.000
0.000 | 0.000
0.000 | 0.000
0.124 | 0.161
0.083 | 0.111
0.392 | 0.420
0.276 | 0.289
0.062 | 0.071
| Plot | Mito | Lyso | Perox | ER | Golgi | PM | Cytosol | Nucleus | |||||
| Expt A |
10 peptides |
32 spectra |
|
0.000 0.000 | 0.000 |
0.000 0.000 | 0.000 |
0.000 0.000 | 0.000 |
0.144 0.124 | 0.161 |
0.098 0.083 | 0.111 |
0.407 0.392 | 0.420 |
0.283 0.276 | 0.289 |
0.067 0.062 | 0.071 |
| 2 spectra, MQEMIAR | 0.000 | 0.000 | 0.000 | 0.000 | 0.409 | 0.316 | 0.190 | 0.085 | ||
| 4 spectra, IIPGAAEK | 0.000 | 0.000 | 0.000 | 0.303 | 0.010 | 0.393 | 0.179 | 0.114 | ||
| 6 spectra, TIISYIDEQFER | 0.000 | 0.000 | 0.000 | 0.262 | 0.000 | 0.356 | 0.266 | 0.116 | ||
| 3 spectra, DQILLEK | 0.000 | 0.000 | 0.000 | 0.259 | 0.000 | 0.384 | 0.297 | 0.060 | ||
| 2 spectra, ADTLTLK | 0.000 | 0.000 | 0.000 | 0.000 | 0.000 | 0.635 | 0.365 | 0.000 | ||
| 1 spectrum, VNIVPVIAK | 0.000 | 0.000 | 0.000 | 0.097 | 0.117 | 0.421 | 0.275 | 0.090 | ||
| 1 spectrum, TMLITHMQDLQEVTQDLHYENFR | 0.000 | 0.000 | 0.066 | 0.000 | 0.000 | 0.610 | 0.324 | 0.000 | ||
| 2 spectra, LTVVDTPGYGDAINSR | 0.000 | 0.000 | 0.000 | 0.165 | 0.072 | 0.381 | 0.254 | 0.128 | ||
| 2 spectra, YLHDESGLNR | 0.000 | 0.000 | 0.000 | 0.139 | 0.286 | 0.183 | 0.329 | 0.063 | ||
| 9 spectra, ILDEIEEHSIK | 0.000 | 0.000 | 0.000 | 0.285 | 0.000 | 0.370 | 0.242 | 0.103 |
| Plot | Mito | Lyso or Perox | ER | Golgi | PM | Cytosol | Nucleus | ||||||
| Expt B |
2 peptides |
2 spectra |
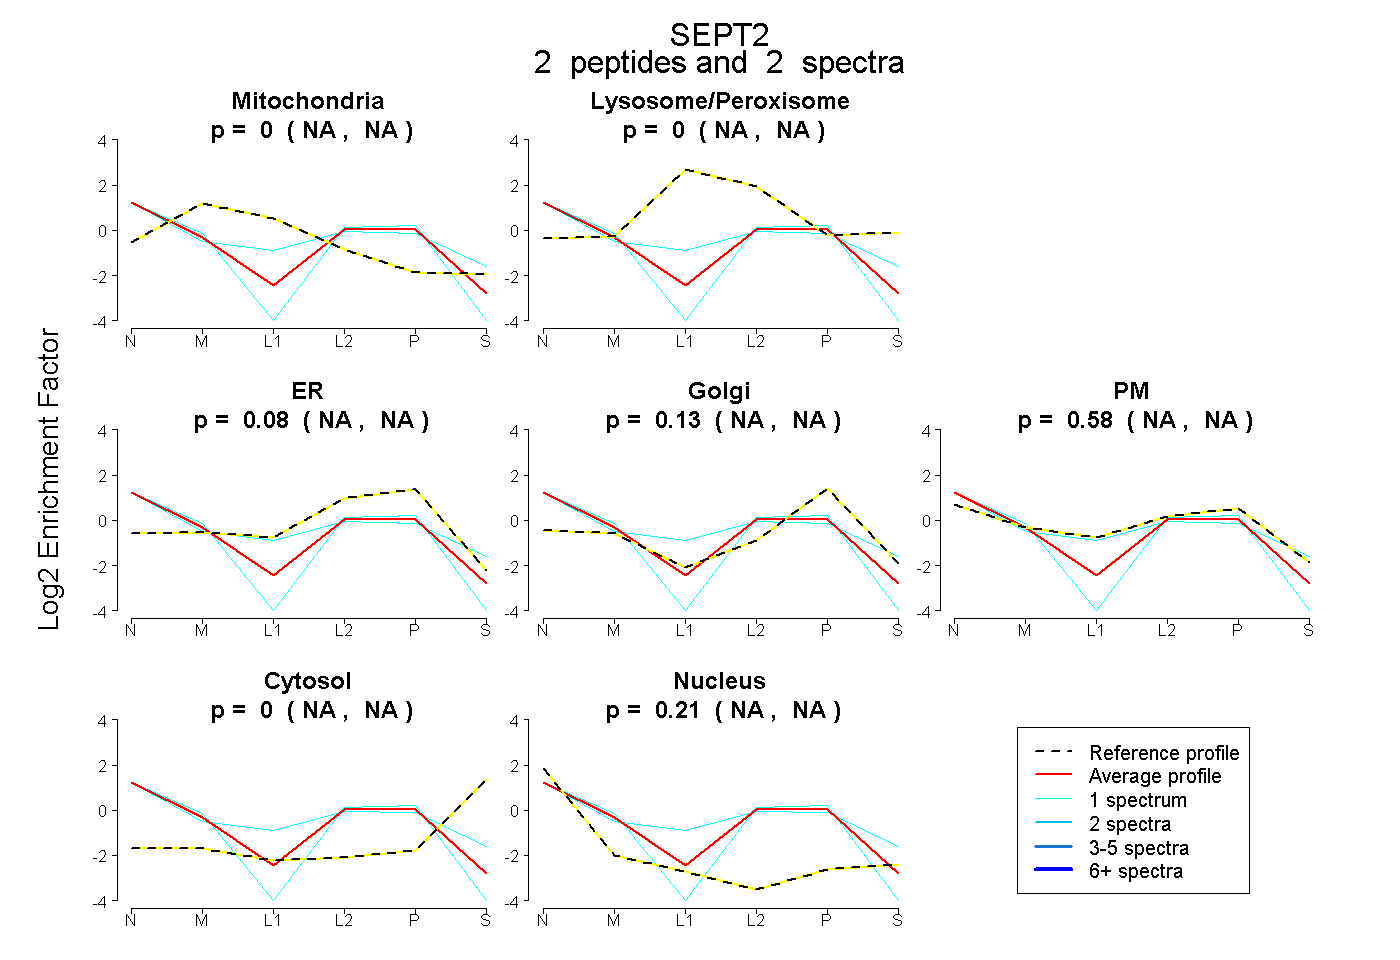 |
0.000 NA | NA |
0.000 NA | NA |
0.084 NA | NA |
0.126 NA | NA |
0.583 NA | NA |
0.000 NA | NA |
0.207 NA | NA |
|||
| Plot | Lyso | Other | |||||||||||
| Expt C |
8 peptides |
42 spectra |
 |
0.000 0.000 | 0.000 |
1.000 1.000 | 1.000 |
||||||||
| Plot | Lyso | Other | |||||||||||
| Expt D |
6 peptides |
11 spectra |
 |
0.000 0.000 | 0.000 |
1.000 1.000 | 1.000 |