 20
20peptides
spectra
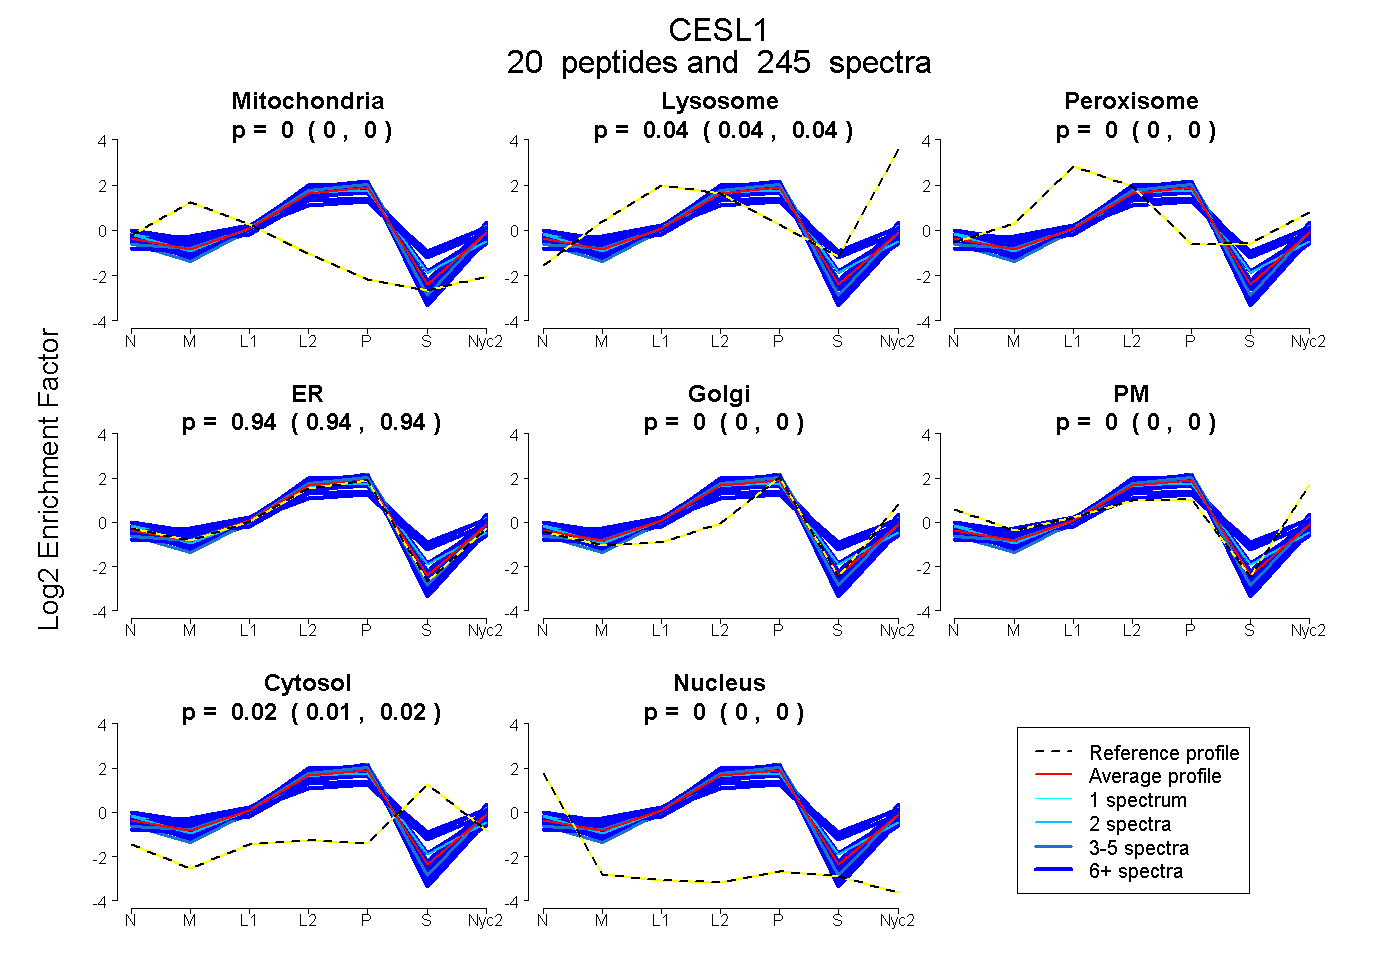
0.000 | 0.000
0.041 | 0.045
0.000 | 0.000
0.938 | 0.944
0.000 | 0.000
0.000 | 0.000
0.013 | 0.018
0.000 | 0.000
19peptides
spectra
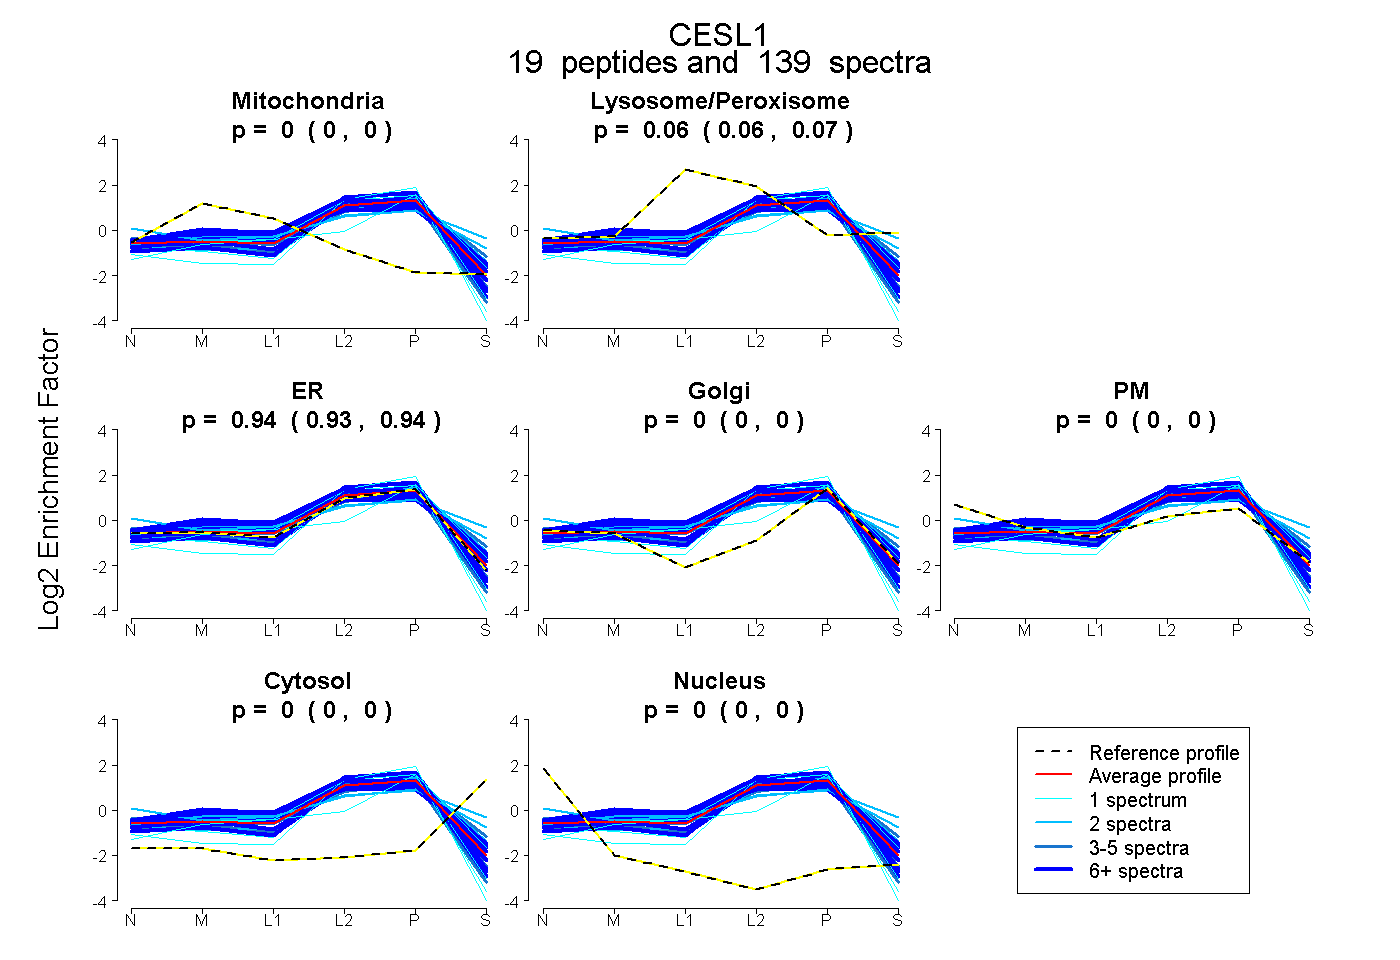
0.000 | 0.000
0.060 | 0.067
0.932 | 0.939
0.000 | 0.000
0.000 | 0.000
0.000 | 0.001
0.000 | 0.000
19peptides
spectra
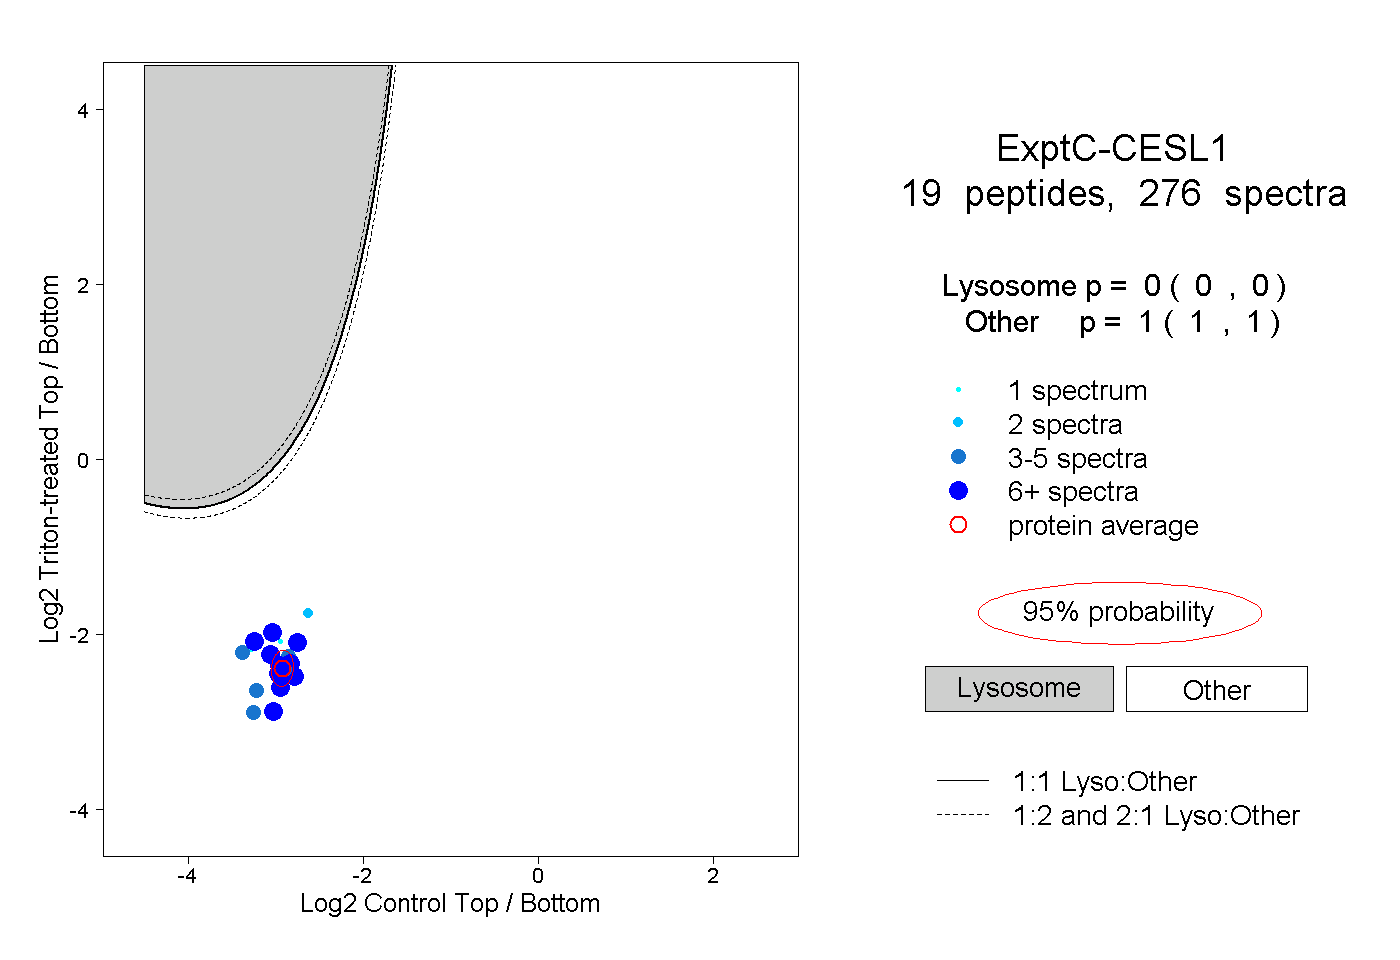
0.000 | 0.000
1.000 | 1.000
8peptides
spectra
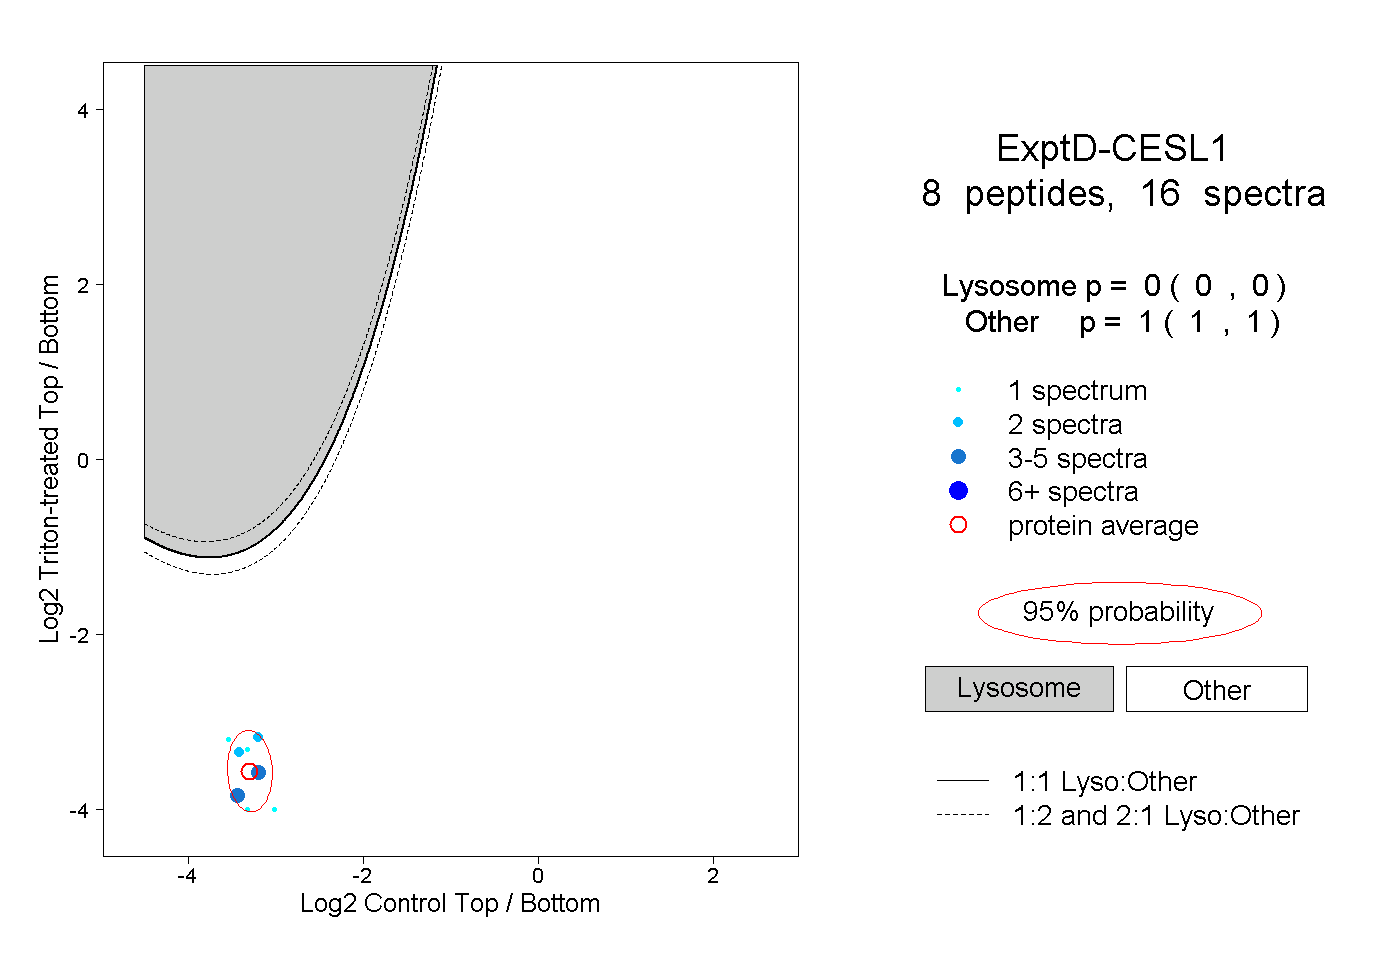
0.000 | 0.000
1.000 | 1.000