 20
20peptides
spectra
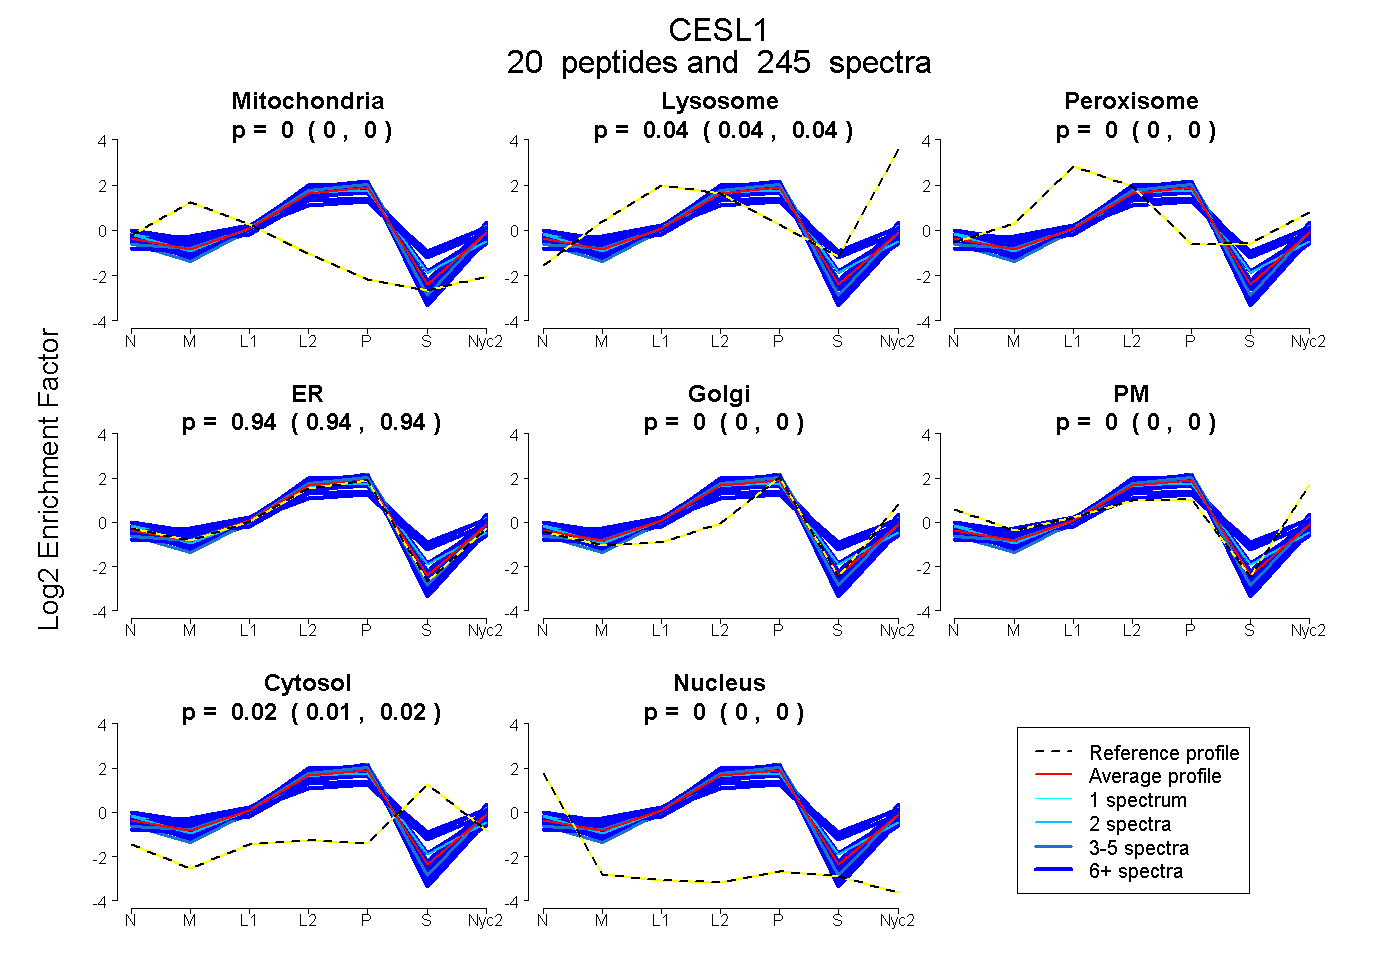
0.000 | 0.000
0.041 | 0.045
0.000 | 0.000
0.938 | 0.944
0.000 | 0.000
0.000 | 0.000
0.013 | 0.018
0.000 | 0.000
| Plot | Mito | Lyso | Perox | ER | Golgi | PM | Cytosol | Nucleus | |||||
| Expt A |
20 peptides |
245 spectra |
|
0.000 0.000 | 0.000 |
0.043 0.041 | 0.045 |
0.000 0.000 | 0.000 |
0.941 0.938 | 0.944 |
0.000 0.000 | 0.000 |
0.000 0.000 | 0.000 |
0.016 0.013 | 0.018 |
0.000 0.000 | 0.000 |
| 4 spectra, FVPPDVK | 0.000 | 0.000 | 0.000 | 0.938 | 0.000 | 0.000 | 0.062 | 0.000 | ||
| 10 spectra, LGIWGFFSTGDEHSR | 0.042 | 0.101 | 0.017 | 0.840 | 0.000 | 0.000 | 0.000 | 0.000 | ||
| 5 spectra, TEEELLEIMEK | 0.000 | 0.029 | 0.000 | 0.971 | 0.000 | 0.000 | 0.000 | 0.000 | ||
| 2 spectra, QPQPHHNEL | 0.000 | 0.000 | 0.055 | 0.877 | 0.000 | 0.000 | 0.068 | 0.000 | ||
| 22 spectra, MNDLLTNR | 0.000 | 0.049 | 0.000 | 0.946 | 0.000 | 0.005 | 0.000 | 0.000 | ||
| 47 spectra, FWANFAR | 0.000 | 0.075 | 0.000 | 0.908 | 0.000 | 0.017 | 0.000 | 0.000 | ||
| 10 spectra, QIADMAGCK | 0.000 | 0.000 | 0.000 | 0.988 | 0.000 | 0.000 | 0.012 | 0.000 | ||
| 7 spectra, FAPPQPAESWSFVK | 0.000 | 0.000 | 0.035 | 0.856 | 0.000 | 0.015 | 0.094 | 0.000 | ||
| 26 spectra, DVRPAAK | 0.000 | 0.000 | 0.000 | 1.000 | 0.000 | 0.000 | 0.000 | 0.000 | ||
| 6 spectra, QECGWLLPTMMR | 0.000 | 0.000 | 0.000 | 1.000 | 0.000 | 0.000 | 0.000 | 0.000 | ||
| 1 spectrum, EEYLQIGATTQQSQGLK | 0.000 | 0.025 | 0.009 | 0.927 | 0.000 | 0.000 | 0.040 | 0.000 | ||
| 9 spectra, GLPHWPQYDQK | 0.000 | 0.037 | 0.096 | 0.572 | 0.000 | 0.118 | 0.178 | 0.000 | ||
| 30 spectra, TTTSAIIVHCLR | 0.000 | 0.000 | 0.144 | 0.568 | 0.000 | 0.132 | 0.156 | 0.000 | ||
| 2 spectra, GSDDPIK | 0.000 | 0.000 | 0.000 | 0.826 | 0.000 | 0.174 | 0.000 | 0.000 | ||
| 10 spectra, DVVGDHADDVYSVFGAPILR | 0.000 | 0.104 | 0.013 | 0.718 | 0.000 | 0.002 | 0.163 | 0.000 | ||
| 8 spectra, NFNTVPYIVGINK | 0.000 | 0.069 | 0.000 | 0.931 | 0.000 | 0.000 | 0.000 | 0.000 | ||
| 11 spectra, AEEVAFWTQLLAK | 0.000 | 0.074 | 0.000 | 0.903 | 0.000 | 0.000 | 0.024 | 0.000 | ||
| 3 spectra, AISESGVVLITELFTK | 0.000 | 0.000 | 0.063 | 0.863 | 0.000 | 0.000 | 0.073 | 0.000 | ||
| 24 spectra, DGASEEEIK | 0.000 | 0.000 | 0.000 | 1.000 | 0.000 | 0.000 | 0.000 | 0.000 | ||
| 8 spectra, MAIMLLEK | 0.000 | 0.026 | 0.000 | 0.974 | 0.000 | 0.000 | 0.000 | 0.000 |
| Plot | Mito | Lyso or Perox | ER | Golgi | PM | Cytosol | Nucleus | ||||||
| Expt B |
19 peptides |
139 spectra |
 |
0.000 0.000 | 0.000 |
0.064 0.060 | 0.067 |
0.936 0.932 | 0.939 |
0.000 0.000 | 0.000 |
0.000 0.000 | 0.000 |
0.000 0.000 | 0.001 |
0.000 0.000 | 0.000 |
|||
| Plot | Lyso | Other | |||||||||||
| Expt C |
19 peptides |
276 spectra |
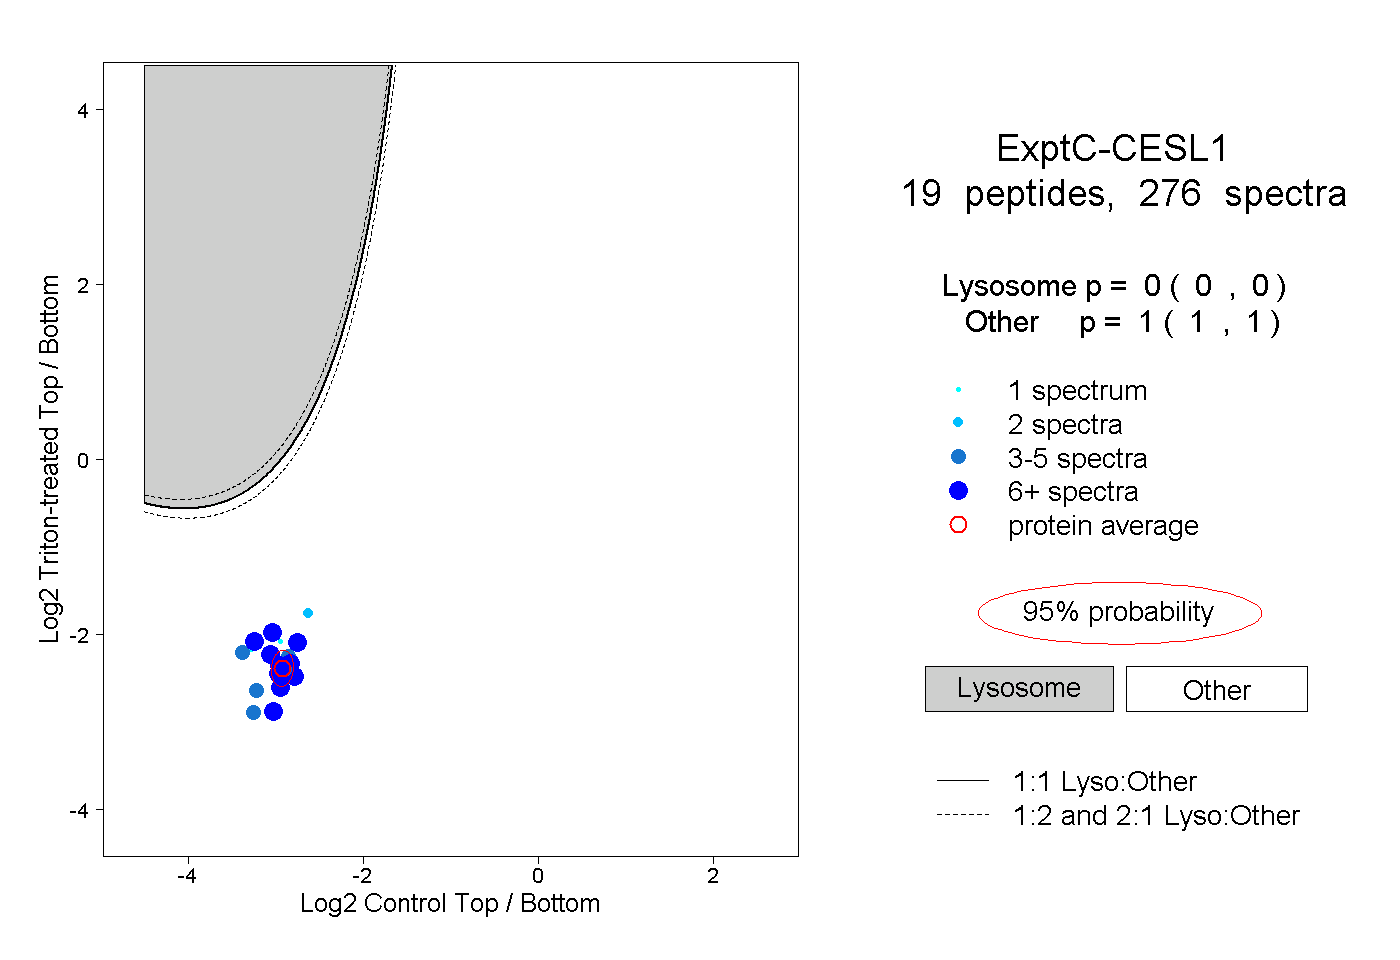 |
0.000 0.000 | 0.000 |
1.000 1.000 | 1.000 |
||||||||
| Plot | Lyso | Other | |||||||||||
| Expt D |
8 peptides |
16 spectra |
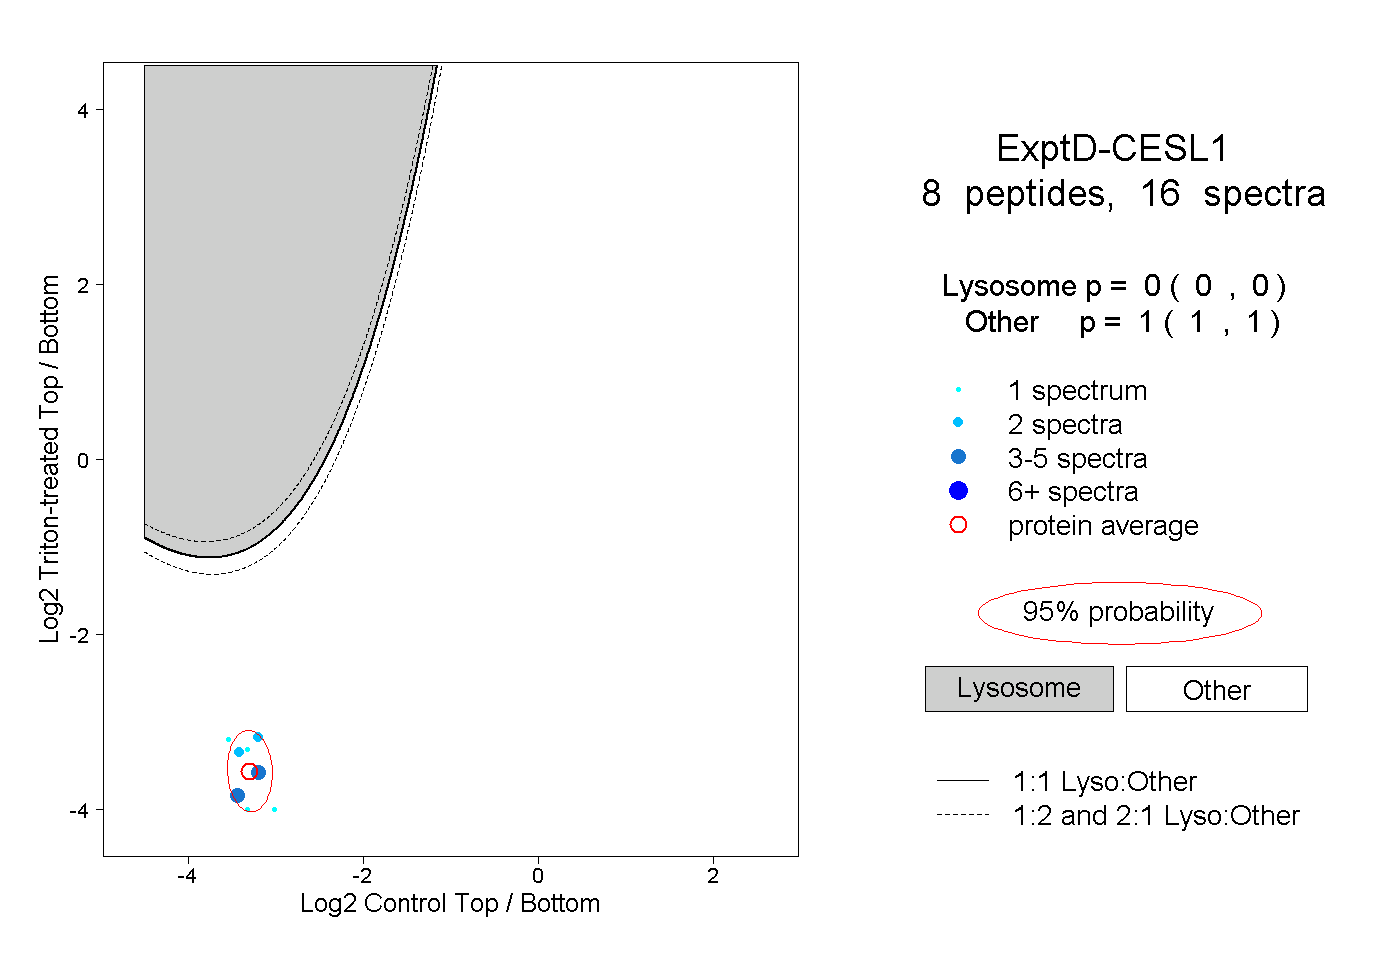 |
0.000 0.000 | 0.000 |
1.000 1.000 | 1.000 |