 8
8peptides
spectra
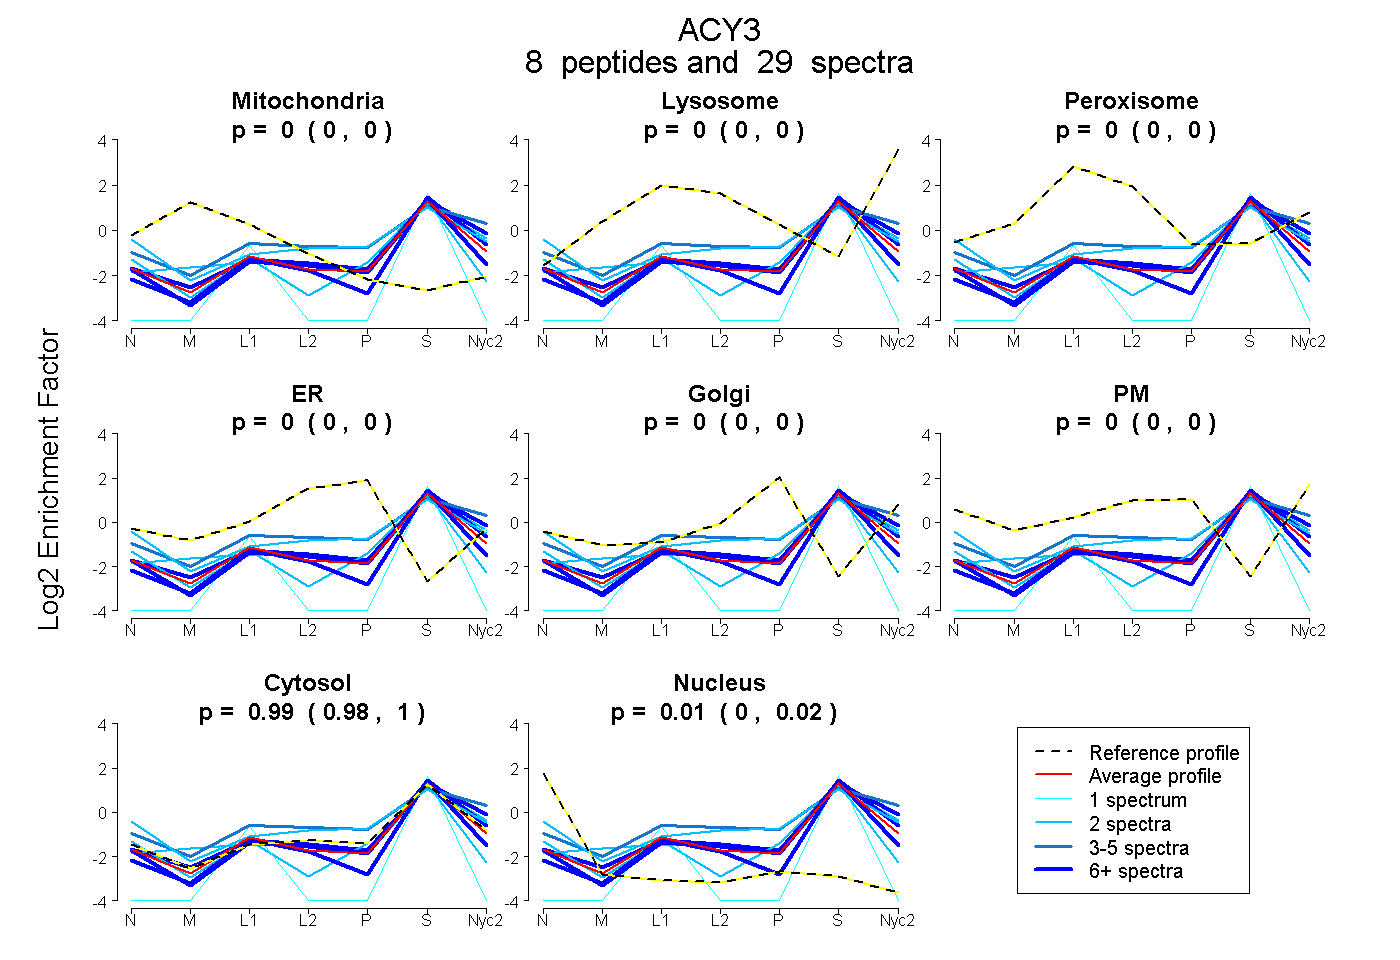
0.000 | 0.000
0.000 | 0.000
0.000 | 0.000
0.000 | 0.000
0.000 | 0.000
0.000 | 0.000
0.980 | 1.000
0.000 | 0.018
3peptides
spectra
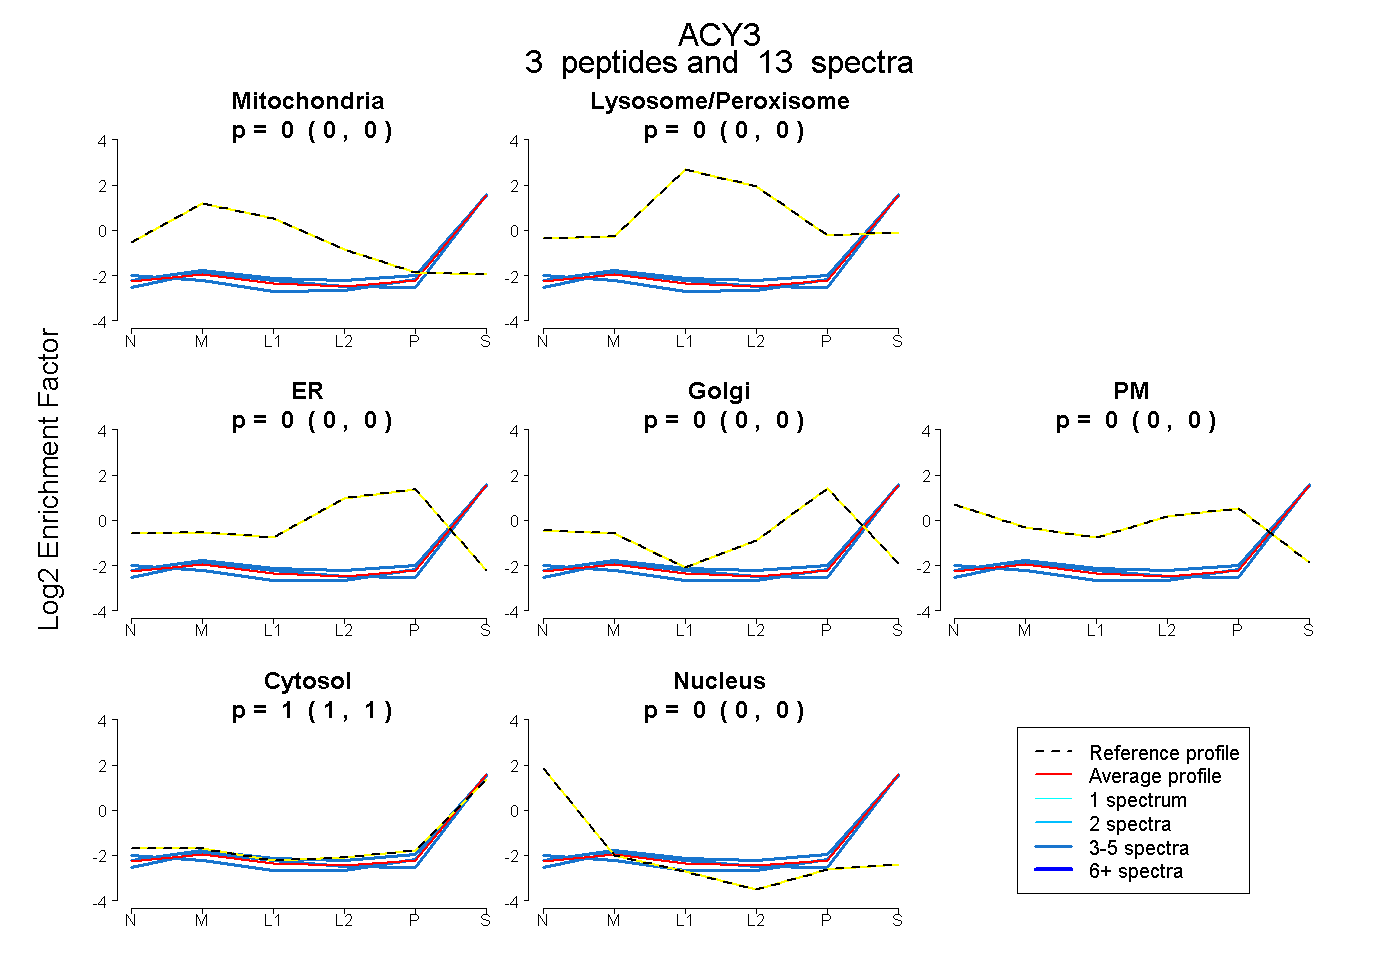
0.000 | 0.000
0.000 | 0.000
0.000 | 0.000
0.000 | 0.000
0.000 | 0.000
1.000 | 1.000
0.000 | 0.000
4peptides
spectra
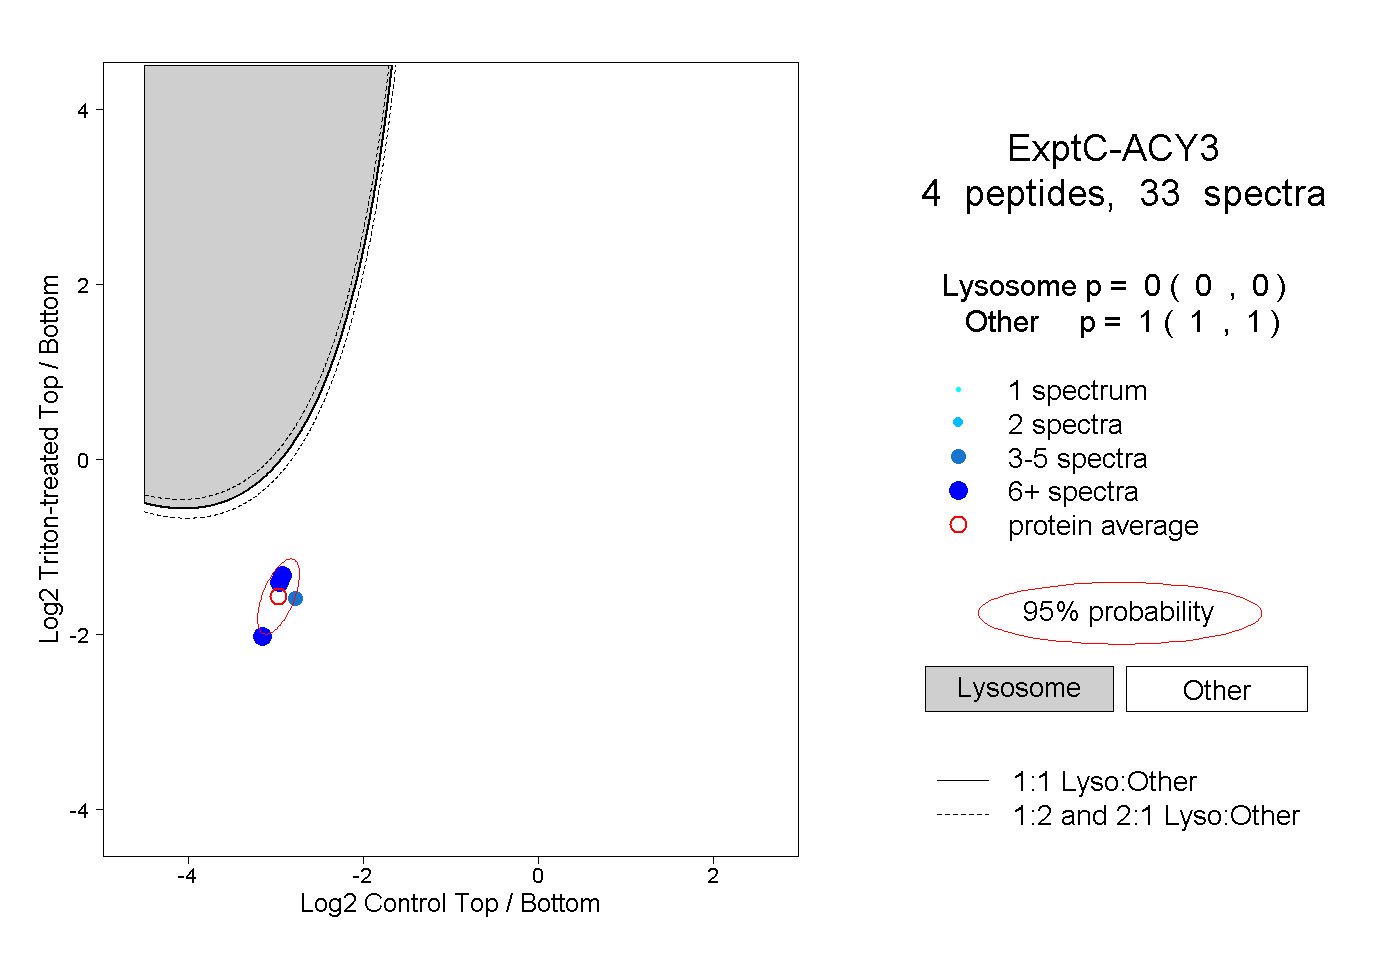
0.000 | 0.000
1.000 | 1.000
4peptides
spectra
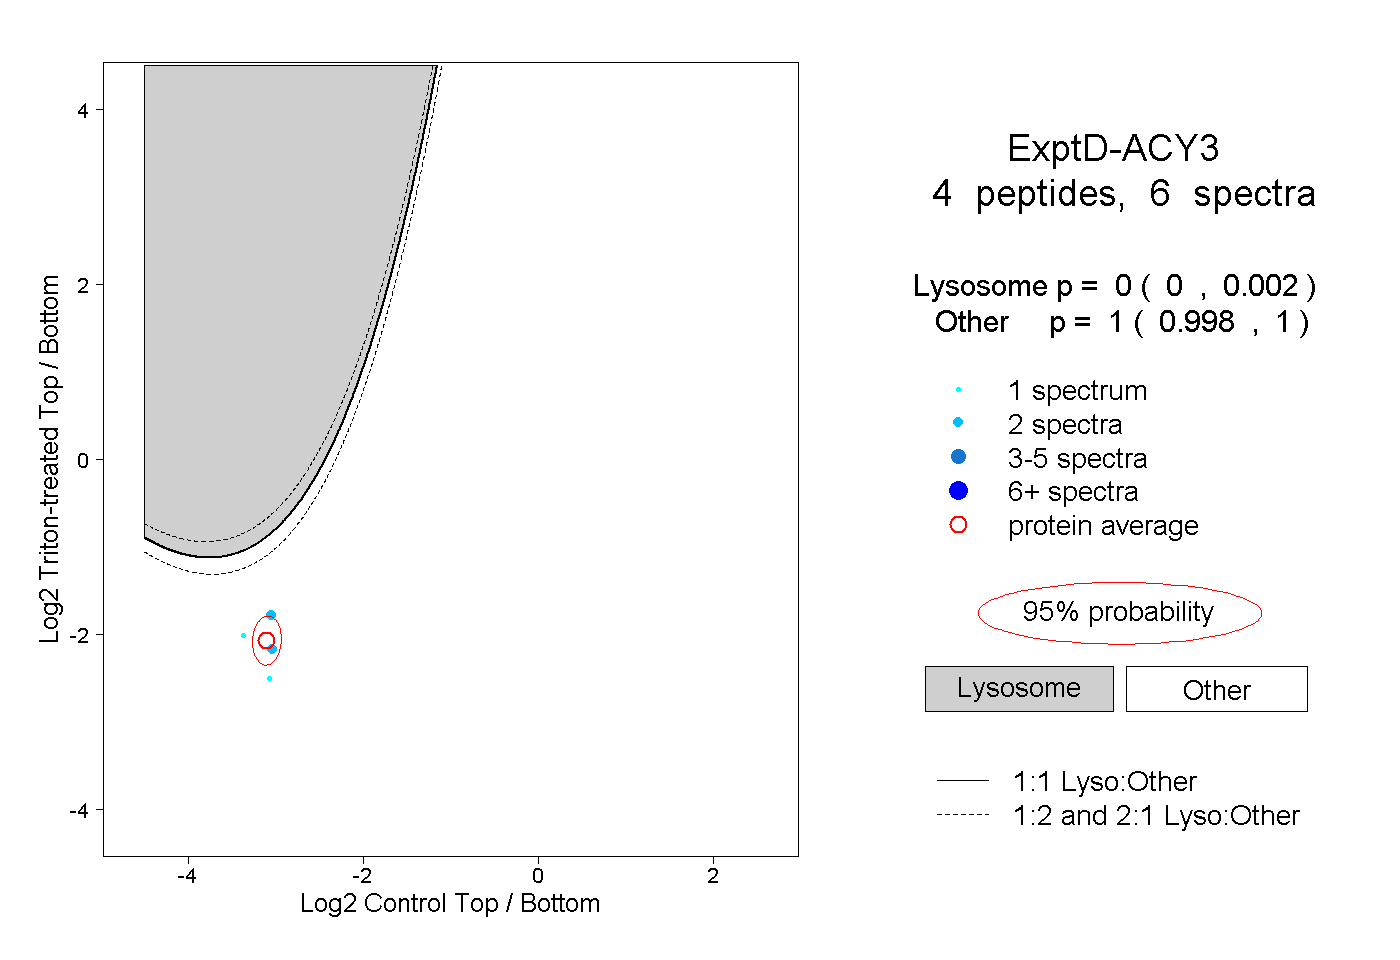
0.000 | 0.002
0.998 | 1.000