 8
8peptides
spectra
0.000 | 0.000
0.000 | 0.000
0.000 | 0.000
0.000 | 0.000
0.000 | 0.000
0.000 | 0.000
0.980 | 1.000
0.000 | 0.018
| Plot | Mito | Lyso | Perox | ER | Golgi | PM | Cytosol | Nucleus | |||||
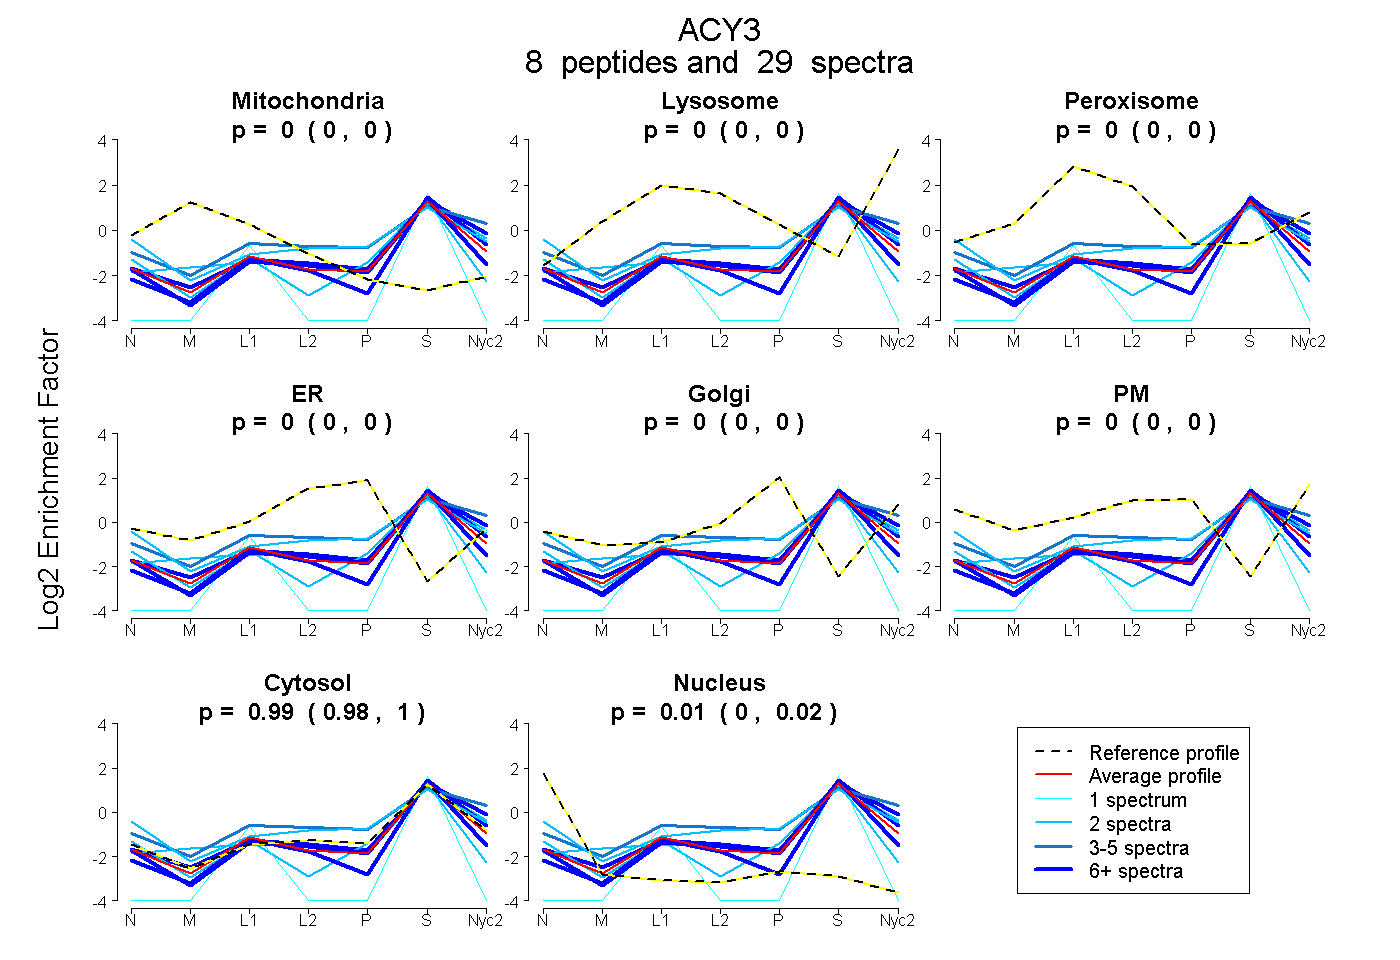
| Expt A |
8 peptides |
29 spectra |
|
0.000 0.000 | 0.000 |
0.000 0.000 | 0.000 |
0.000 0.000 | 0.000 |
0.000 0.000 | 0.000 |
0.000 0.000 | 0.000 |
0.000 0.000 | 0.000 |
0.993 0.980 | 1.000 |
0.007 0.000 | 0.018 |
| 7 spectra, VAVTGGTHGNEMCGVYLAR | 0.000 | 0.000 | 0.000 | 0.000 | 0.000 | 0.000 | 0.962 | 0.038 | ||
| 2 spectra, TTDGHLTGTVHSR | 0.000 | 0.000 | 0.000 | 0.000 | 0.000 | 0.183 | 0.816 | 0.002 | ||
| 1 spectrum, ISVPALPGLTPSSTQTP | 0.000 | 0.000 | 0.000 | 0.000 | 0.000 | 0.000 | 0.846 | 0.154 | ||
| 2 spectra, AQELNQLLGPK | 0.000 | 0.000 | 0.000 | 0.000 | 0.000 | 0.000 | 0.832 | 0.168 | ||
| 6 spectra, AELFSQMR | 0.000 | 0.046 | 0.000 | 0.000 | 0.000 | 0.000 | 0.954 | 0.000 | ||
| 2 spectra, LFQFEPPGTESYSMDSVSK | 0.060 | 0.036 | 0.000 | 0.000 | 0.000 | 0.000 | 0.904 | 0.000 | ||
| 6 spectra, LQDHDFEPLRPGEPIFK | 0.000 | 0.000 | 0.000 | 0.000 | 0.000 | 0.000 | 1.000 | 0.000 | ||
| 3 spectra, NLGSVDFPR | 0.000 | 0.186 | 0.010 | 0.000 | 0.000 | 0.038 | 0.765 | 0.000 |
| Plot | Mito | Lyso or Perox | ER | Golgi | PM | Cytosol | Nucleus | ||||||
| Expt B |
3 peptides |
13 spectra |
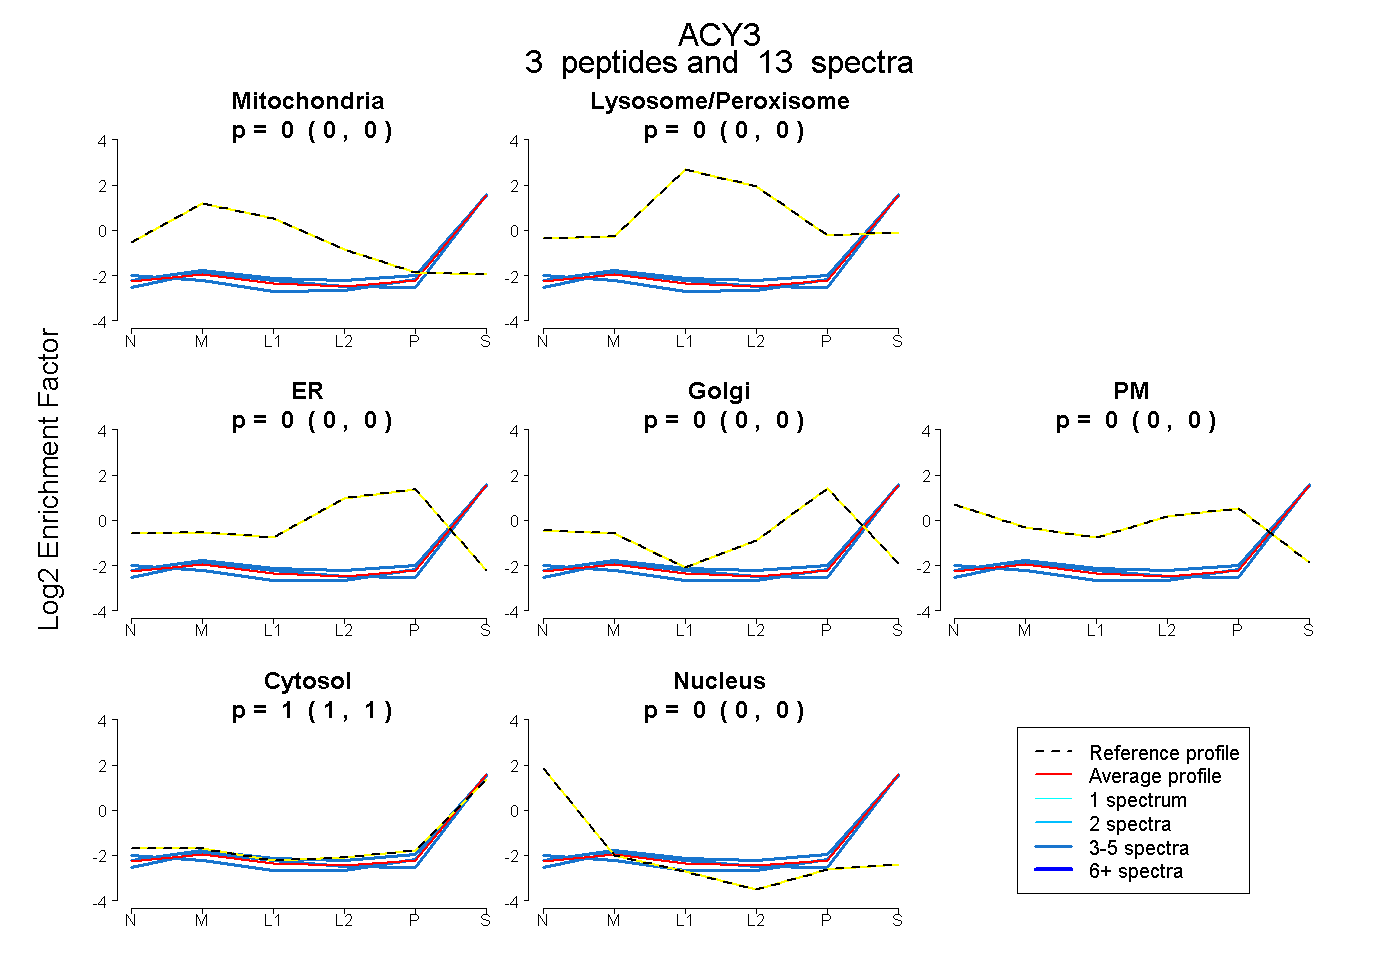 |
0.000 0.000 | 0.000 |
0.000 0.000 | 0.000 |
0.000 0.000 | 0.000 |
0.000 0.000 | 0.000 |
0.000 0.000 | 0.000 |
1.000 1.000 | 1.000 |
0.000 0.000 | 0.000 |
|||
| Plot | Lyso | Other | |||||||||||
| Expt C |
4 peptides |
33 spectra |
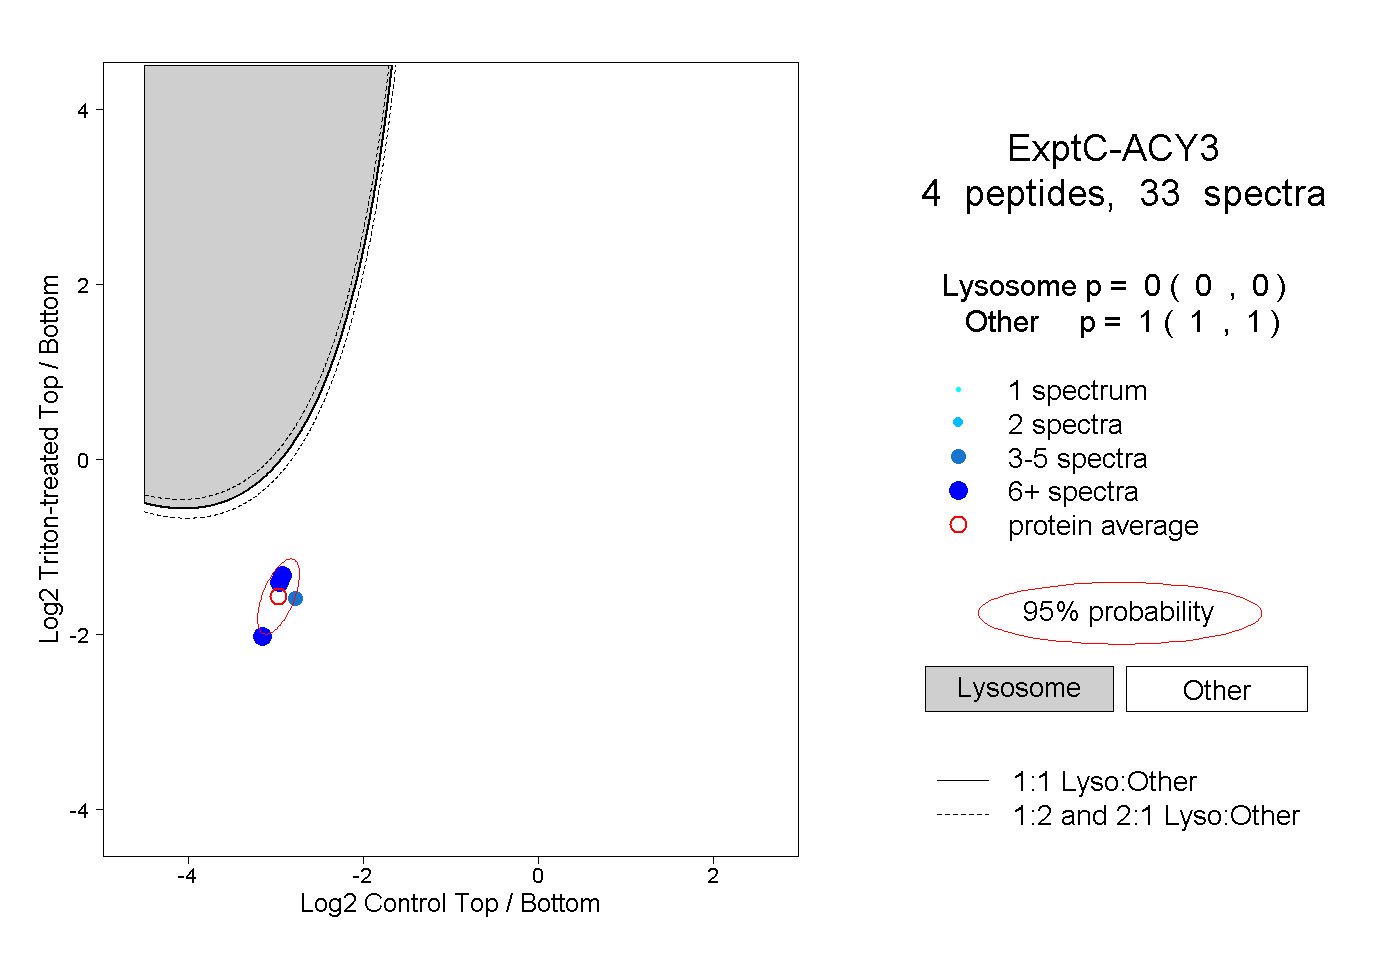 |
0.000 0.000 | 0.000 |
1.000 1.000 | 1.000 |
||||||||
| Plot | Lyso | Other | |||||||||||
| Expt D |
4 peptides |
6 spectra |
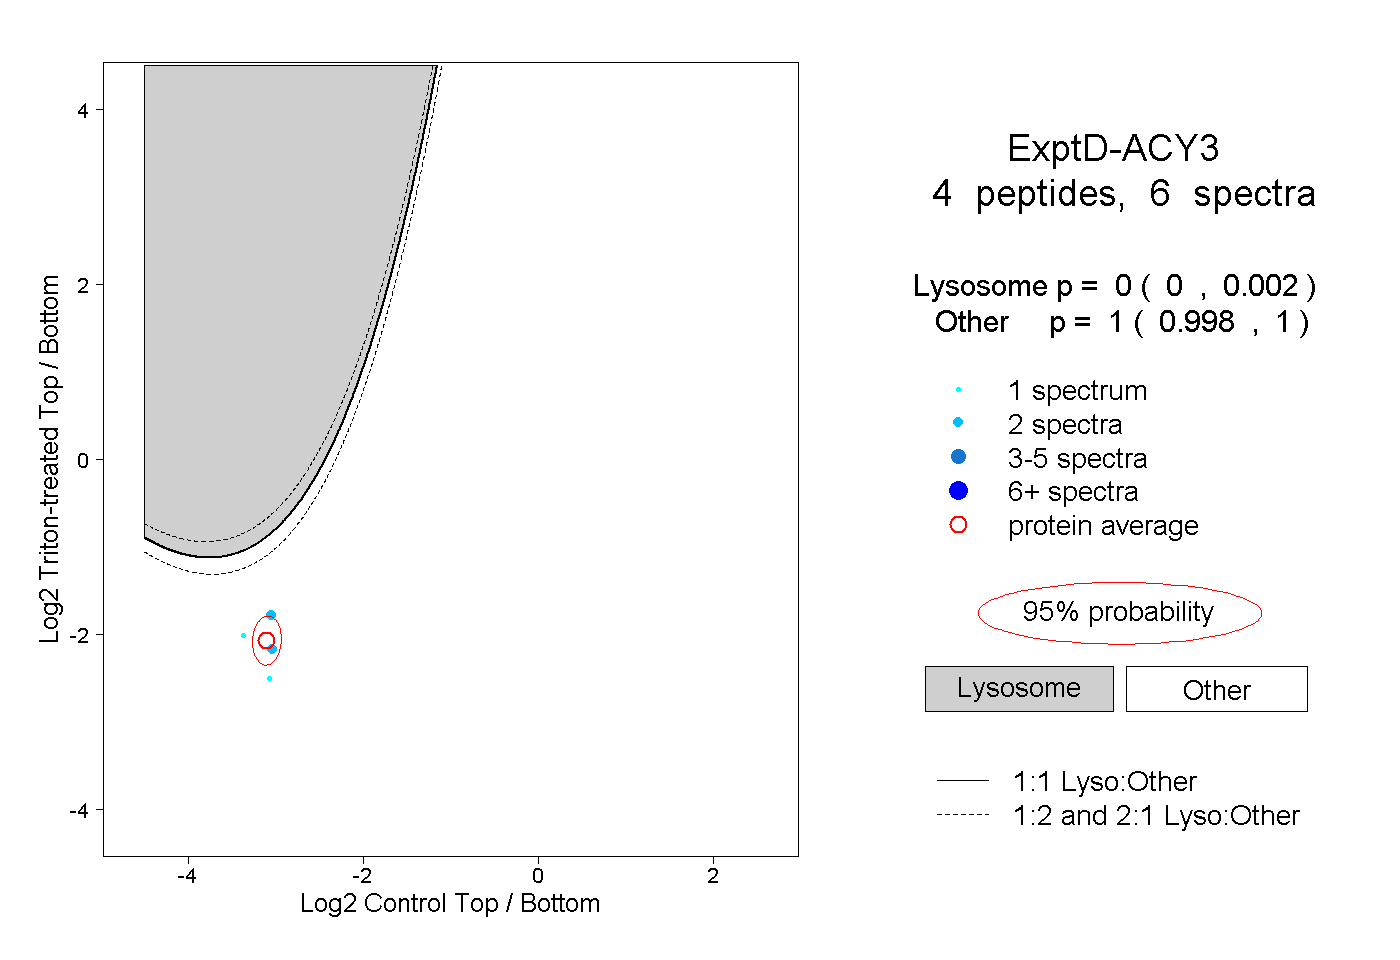 |
0.000 0.000 | 0.002 |
1.000 0.998 | 1.000 |