 7
7peptides
spectra
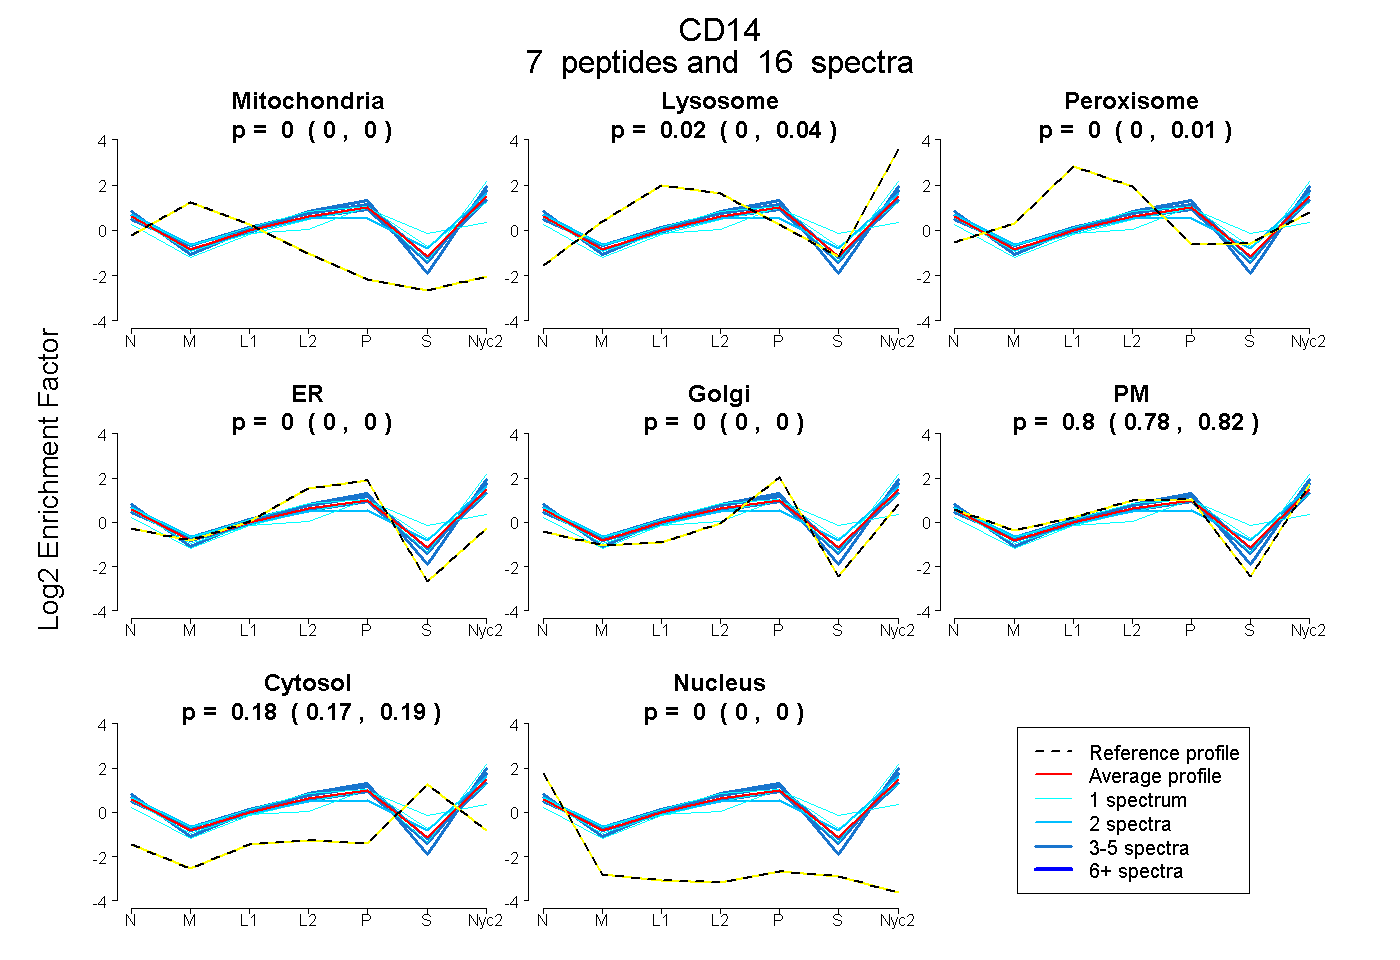
0.000 | 0.000
0.000 | 0.036
0.000 | 0.009
0.000 | 0.000
0.000 | 0.000
0.780 | 0.818
0.165 | 0.186
0.000 | 0.000
3peptides
spectra
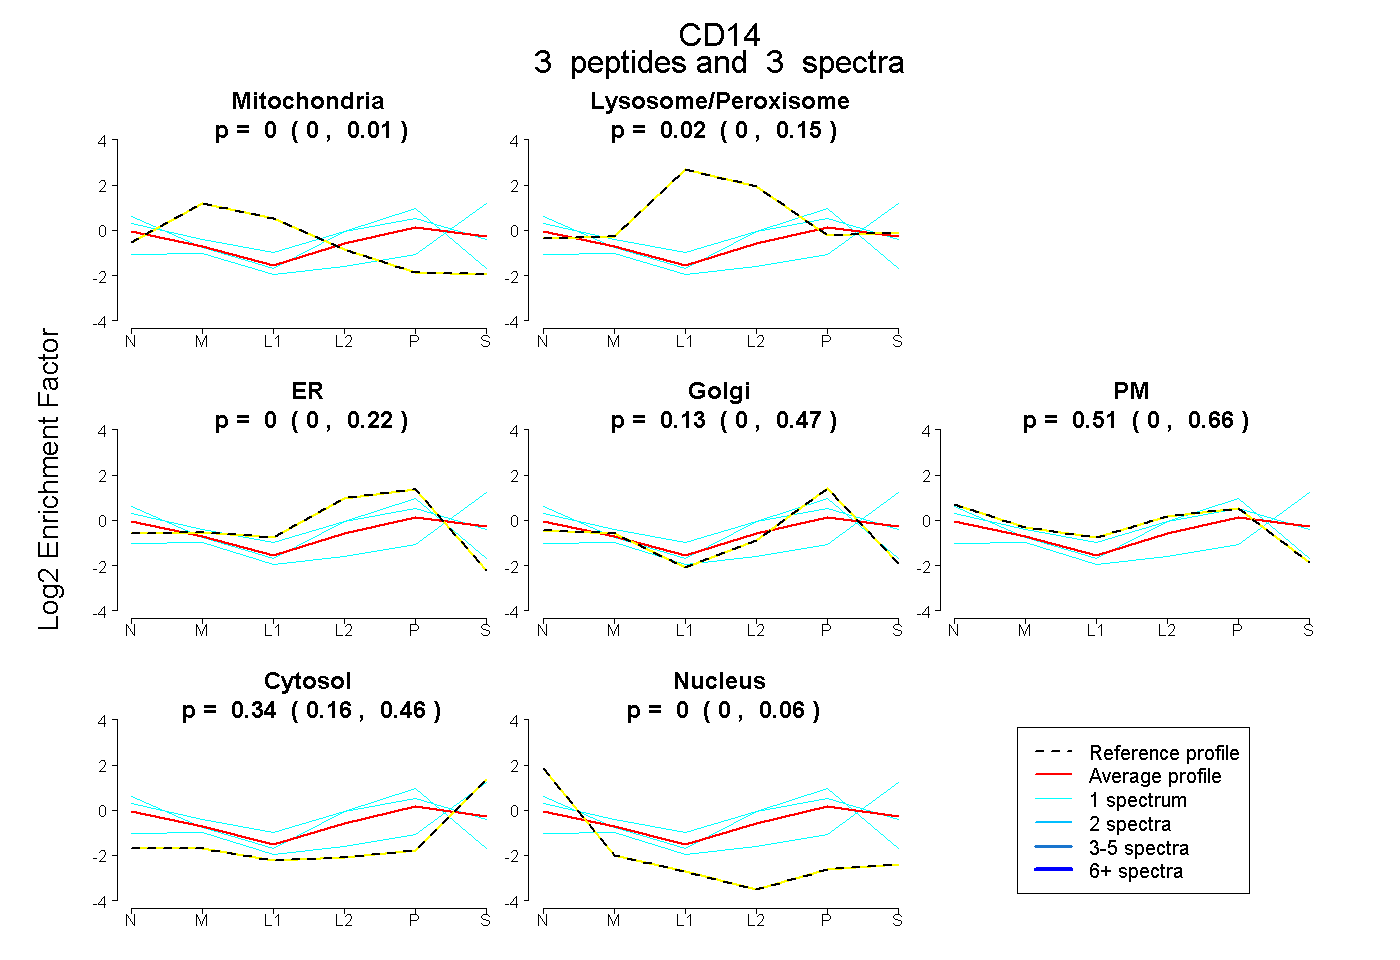
0.000 | 0.014
0.000 | 0.148
0.000 | 0.218
0.000 | 0.466
0.000 | 0.657
0.164 | 0.459
0.000 | 0.061
7peptides
spectra
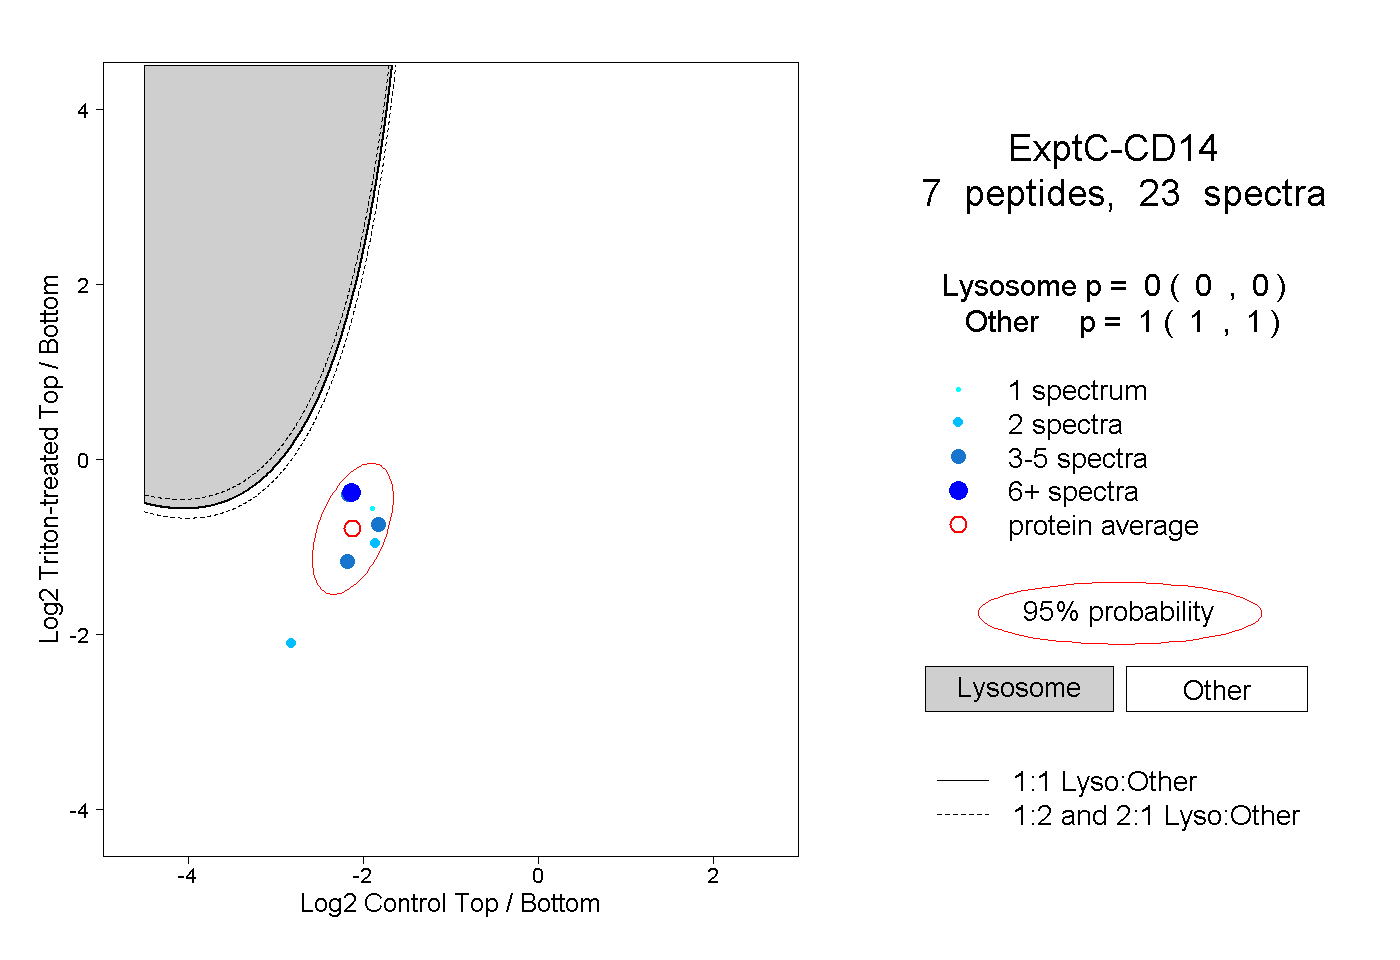
0.000 | 0.000
1.000 | 1.000
1peptide
spectra
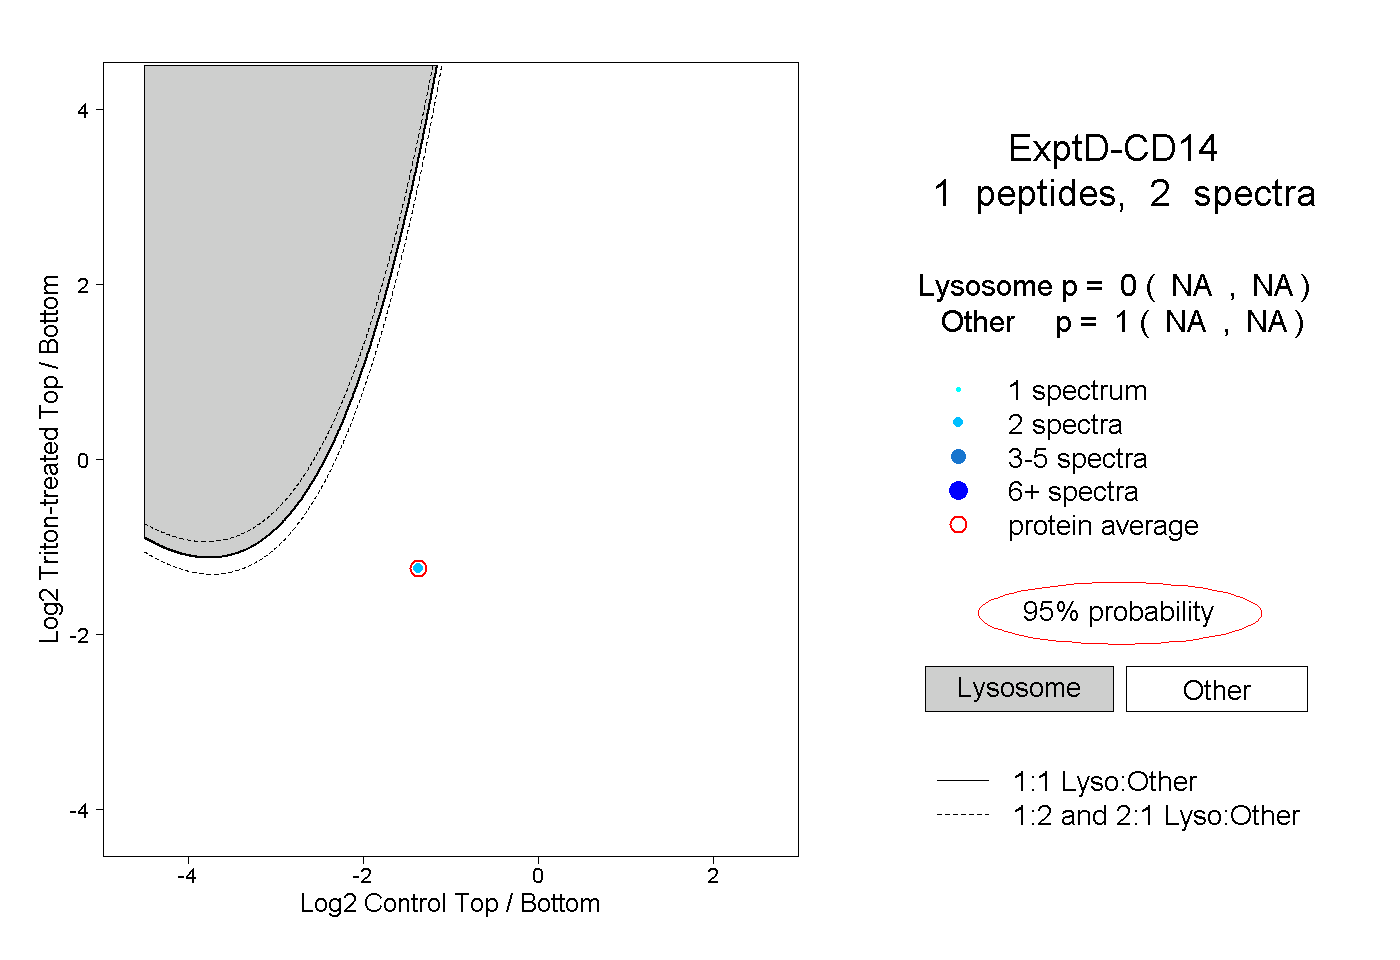
NA | NA
NA | NA