 7
7peptides
spectra
0.000 | 0.000
0.000 | 0.036
0.000 | 0.009
0.000 | 0.000
0.000 | 0.000
0.780 | 0.818
0.165 | 0.186
0.000 | 0.000
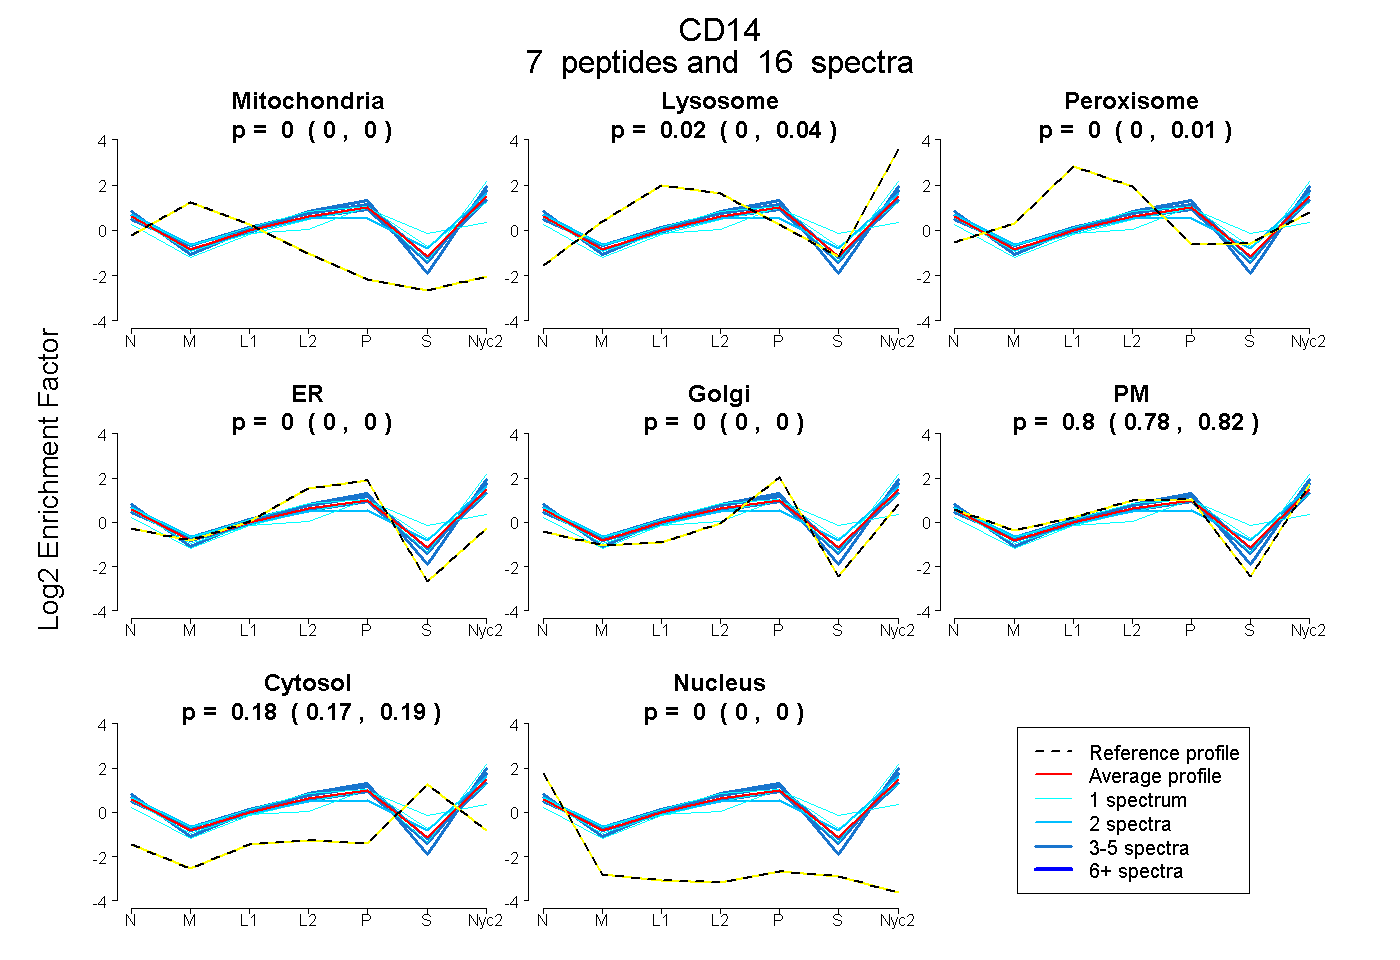
| Plot | Mito | Lyso | Perox | ER | Golgi | PM | Cytosol | Nucleus | |||||
| Expt A |
7 peptides |
16 spectra |
|
0.000 0.000 | 0.000 |
0.021 0.000 | 0.036 |
0.000 0.000 | 0.009 |
0.000 0.000 | 0.000 |
0.000 0.000 | 0.000 |
0.802 0.780 | 0.818 |
0.177 0.165 | 0.186 |
0.000 0.000 | 0.000 |
| 1 spectrum, VDTEANLGQYTDIIR | 0.000 | 0.112 | 0.000 | 0.000 | 0.000 | 0.798 | 0.090 | 0.000 | ||
| 2 spectra, SLEYLLK | 0.000 | 0.071 | 0.011 | 0.000 | 0.000 | 0.699 | 0.219 | 0.000 | ||
| 5 spectra, GLISALCPHK | 0.000 | 0.000 | 0.079 | 0.000 | 0.069 | 0.716 | 0.136 | 0.000 | ||
| 3 spectra, LSVLDLSYNR | 0.000 | 0.000 | 0.000 | 0.000 | 0.000 | 0.854 | 0.146 | 0.000 | ||
| 1 spectrum, NAGMETTSGVCSALAAAR | 0.000 | 0.000 | 0.078 | 0.198 | 0.000 | 0.372 | 0.352 | 0.000 | ||
| 3 spectra, FPTLQVLALR | 0.000 | 0.006 | 0.000 | 0.000 | 0.084 | 0.866 | 0.044 | 0.000 | ||
| 1 spectrum, VLGYSGLR | 0.000 | 0.000 | 0.000 | 0.000 | 0.035 | 0.700 | 0.265 | 0.000 |
| Plot | Mito | Lyso or Perox | ER | Golgi | PM | Cytosol | Nucleus | ||||||
| Expt B |
3 peptides |
3 spectra |
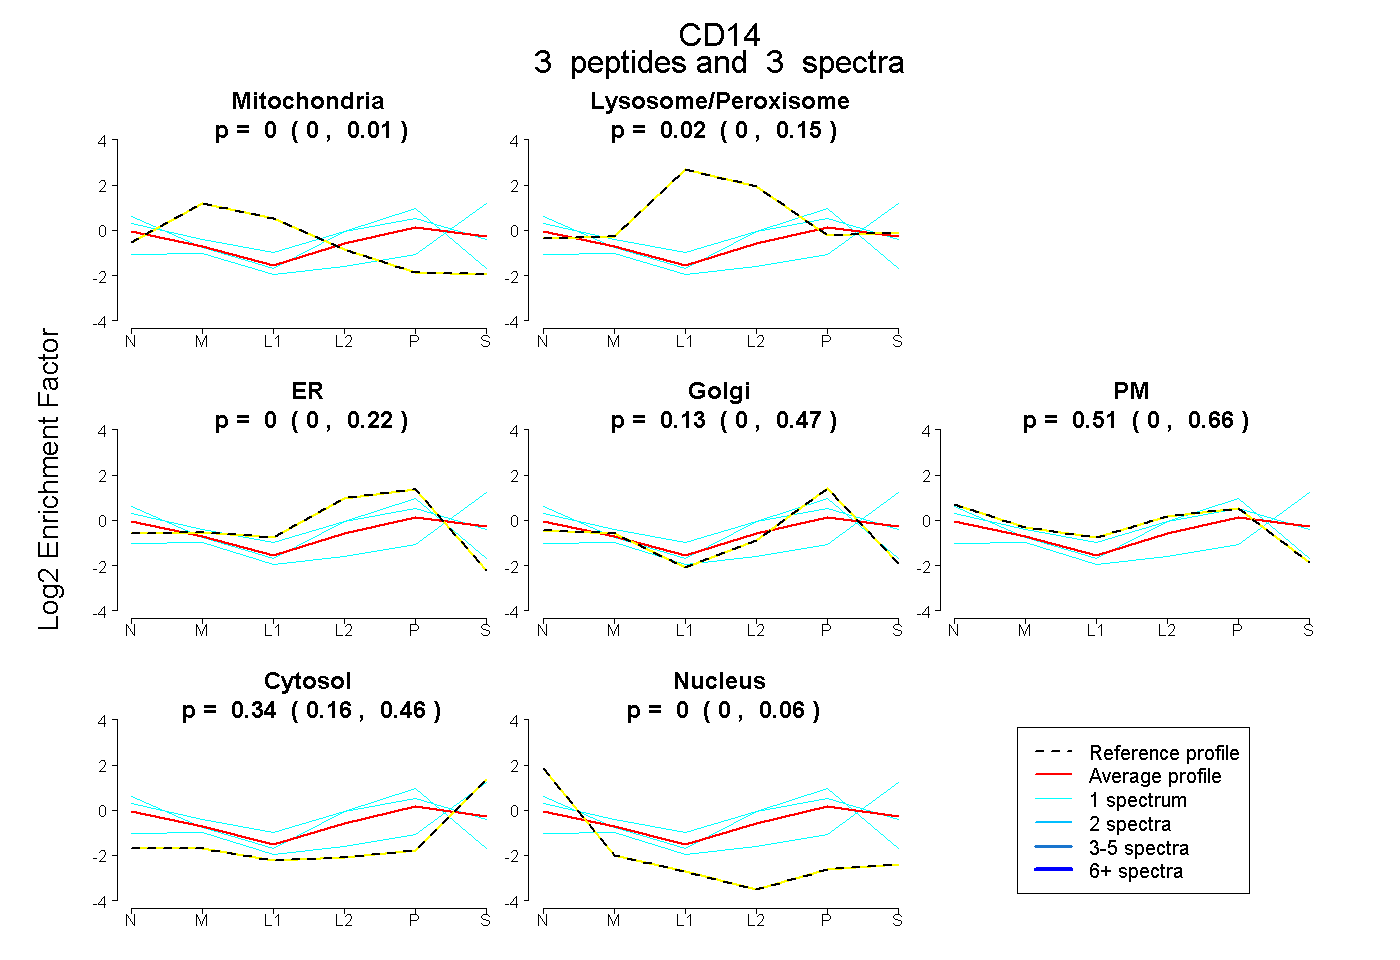 |
0.000 0.000 | 0.014 |
0.020 0.000 | 0.148 |
0.000 0.000 | 0.218 |
0.130 0.000 | 0.466 |
0.510 0.000 | 0.657 |
0.340 0.164 | 0.459 |
0.000 0.000 | 0.061 |
|||
| Plot | Lyso | Other | |||||||||||
| Expt C |
7 peptides |
23 spectra |
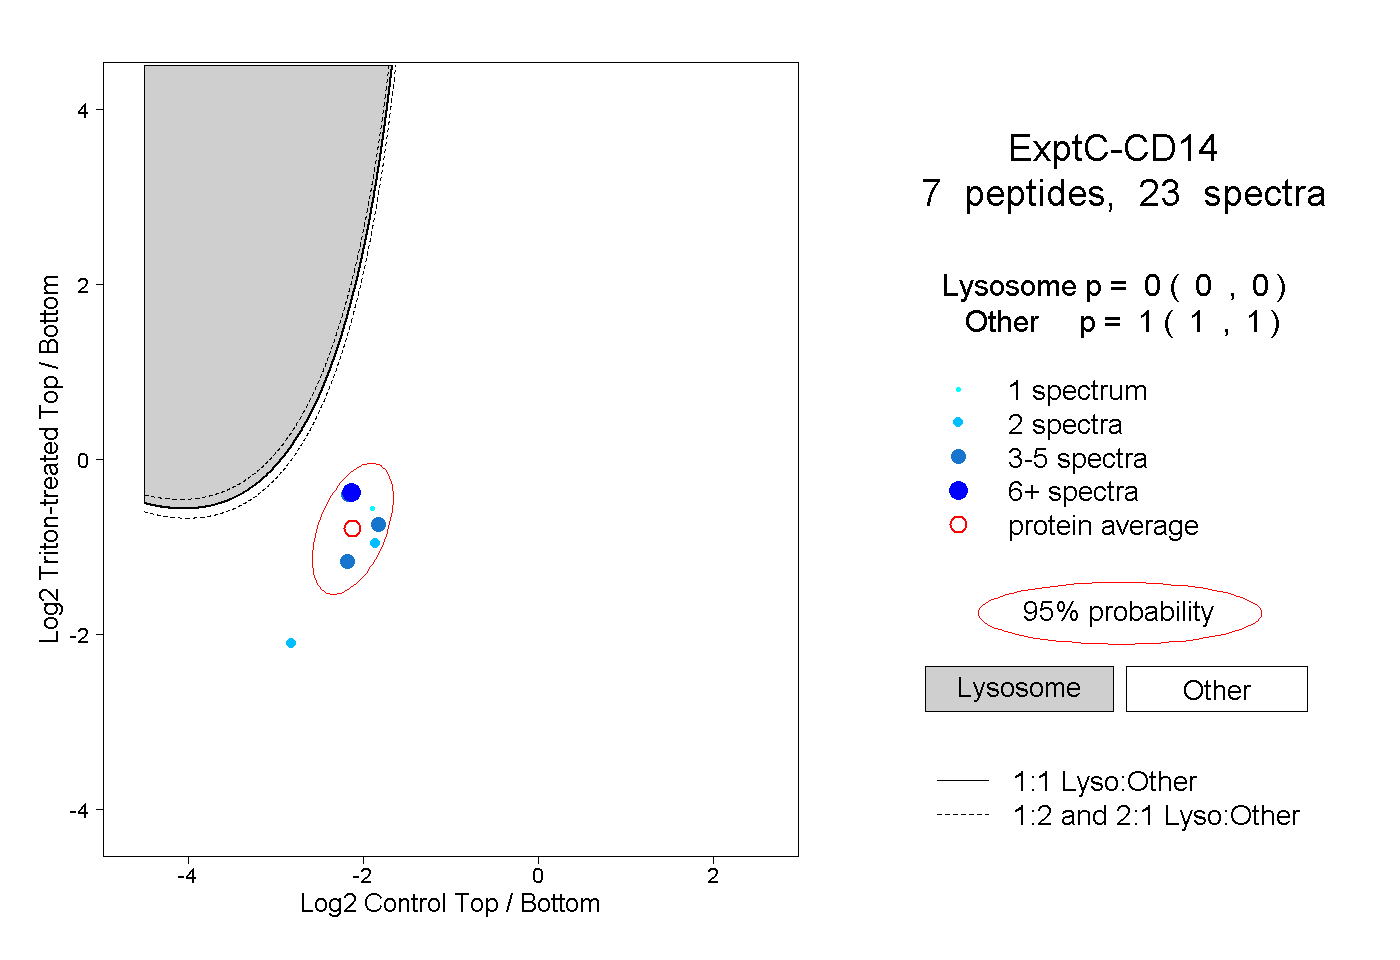 |
0.000 0.000 | 0.000 |
1.000 1.000 | 1.000 |
||||||||
| Plot | Lyso | Other | |||||||||||
| Expt D |
1 peptide |
2 spectra |
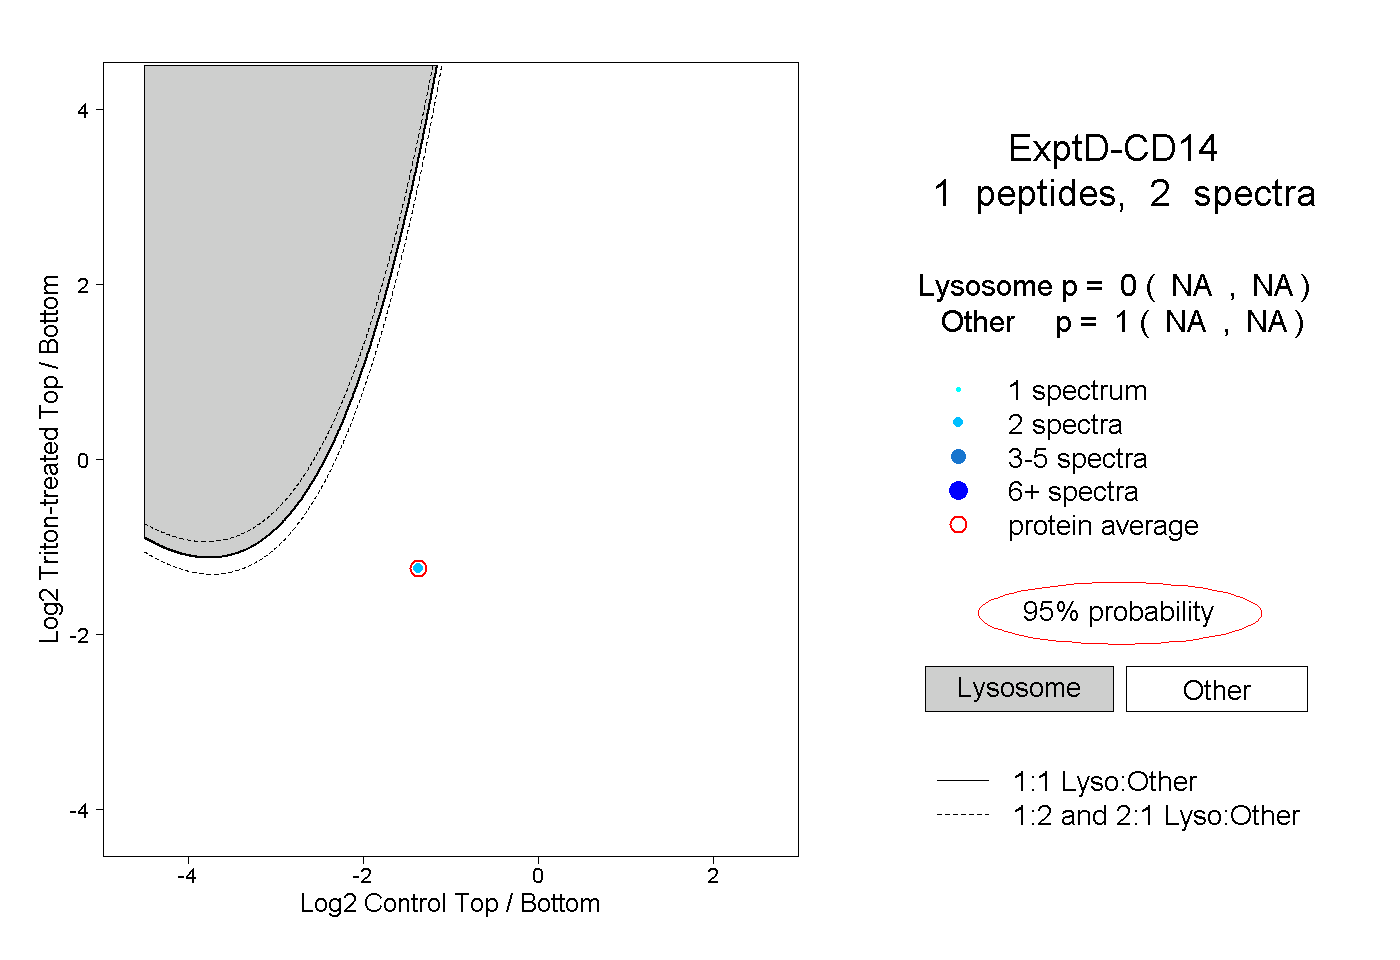 |
0.000 NA | NA |
1.000 NA | NA |