 7
7peptides
spectra
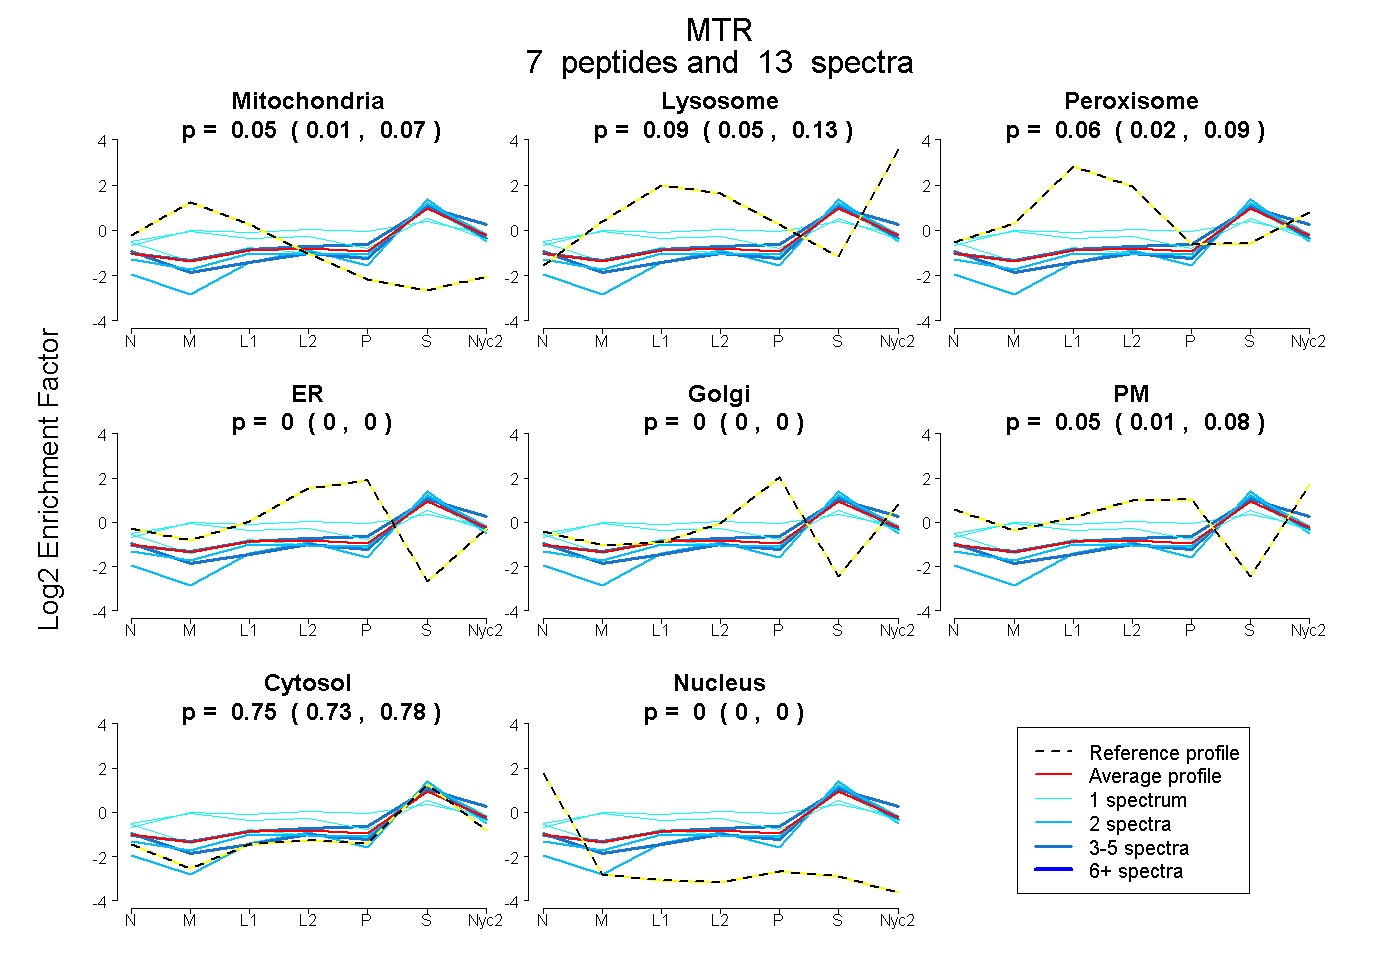
0.014 | 0.074
0.053 | 0.129
0.020 | 0.088
0.000 | 0.000
0.000 | 0.001
0.008 | 0.081
0.729 | 0.775
0.000 | 0.000
1peptide
spectrum
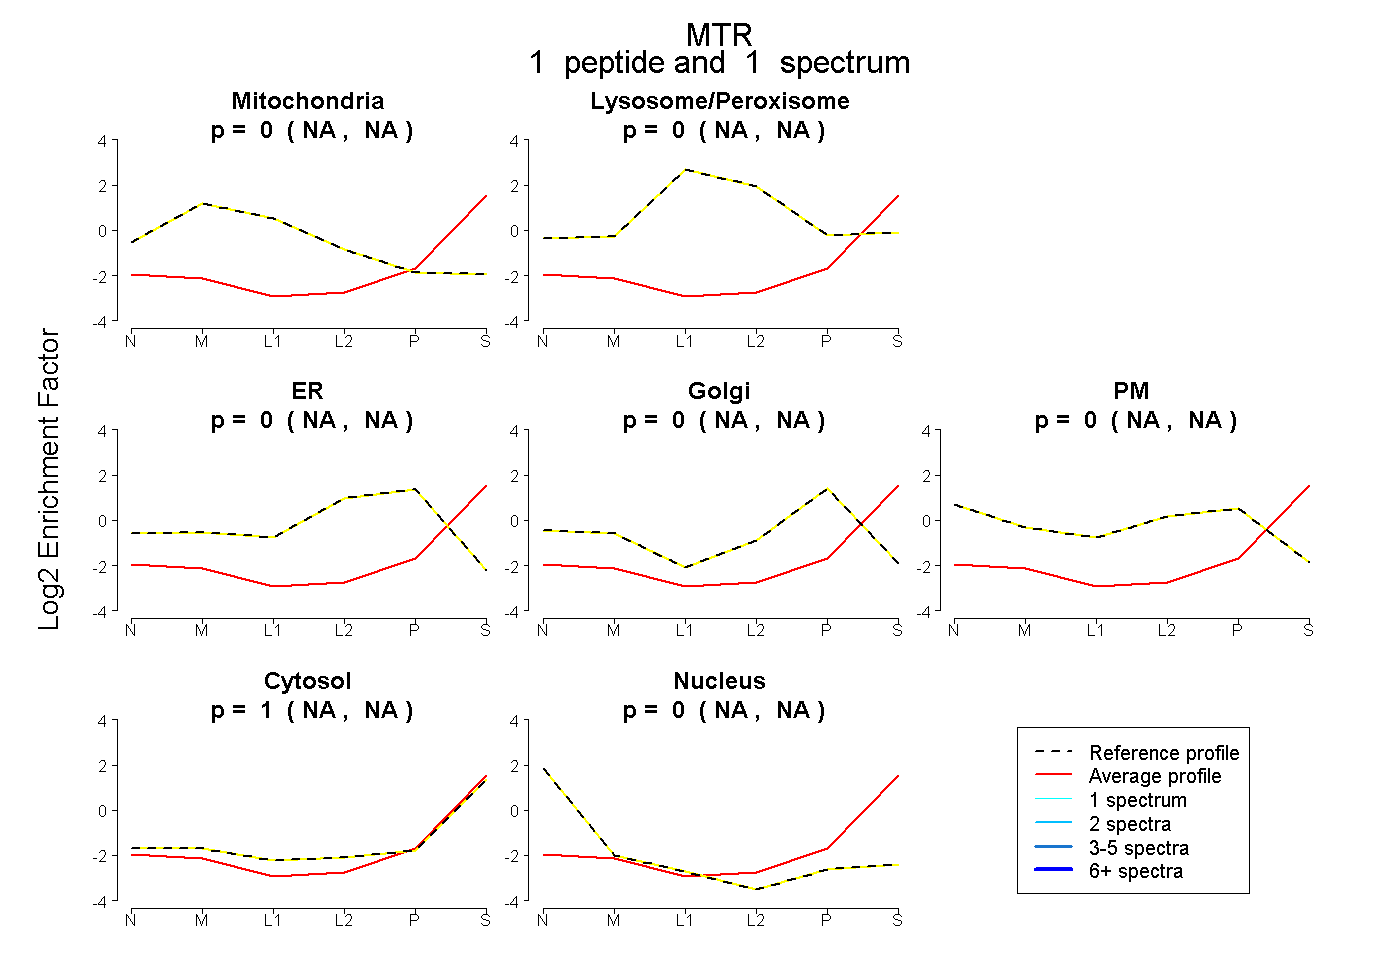
NA | NA
NA | NA
NA | NA
NA | NA
NA | NA
NA | NA
NA | NA
5peptides
spectra
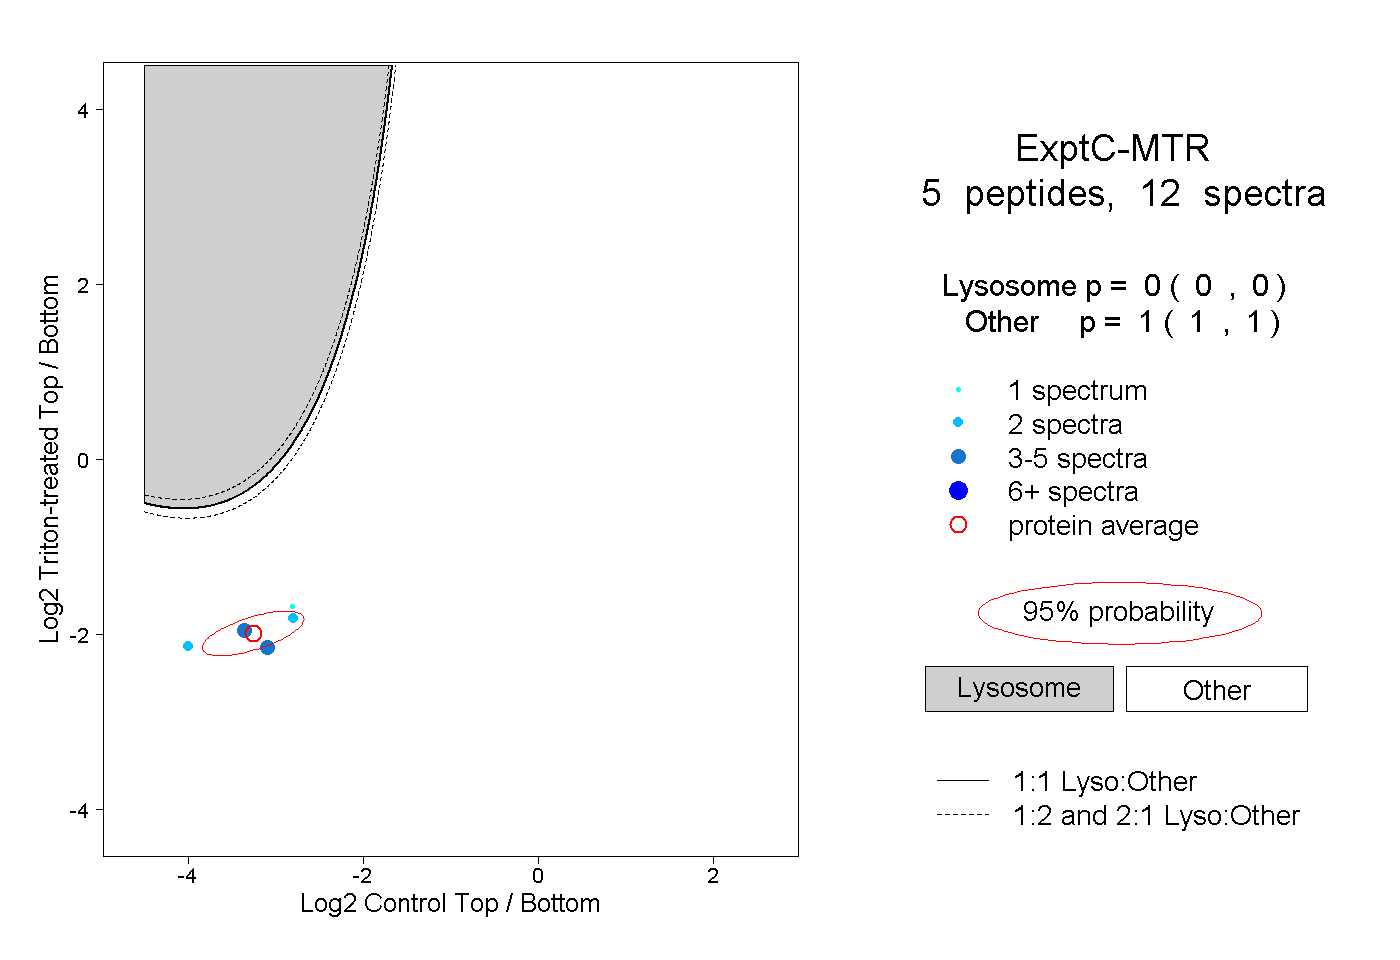
0.000 | 0.000
1.000 | 1.000