 7
7peptides
spectra
0.014 | 0.074
0.053 | 0.129
0.020 | 0.088
0.000 | 0.000
0.000 | 0.001
0.008 | 0.081
0.729 | 0.775
0.000 | 0.000
| Plot | Mito | Lyso | Perox | ER | Golgi | PM | Cytosol | Nucleus | |||||
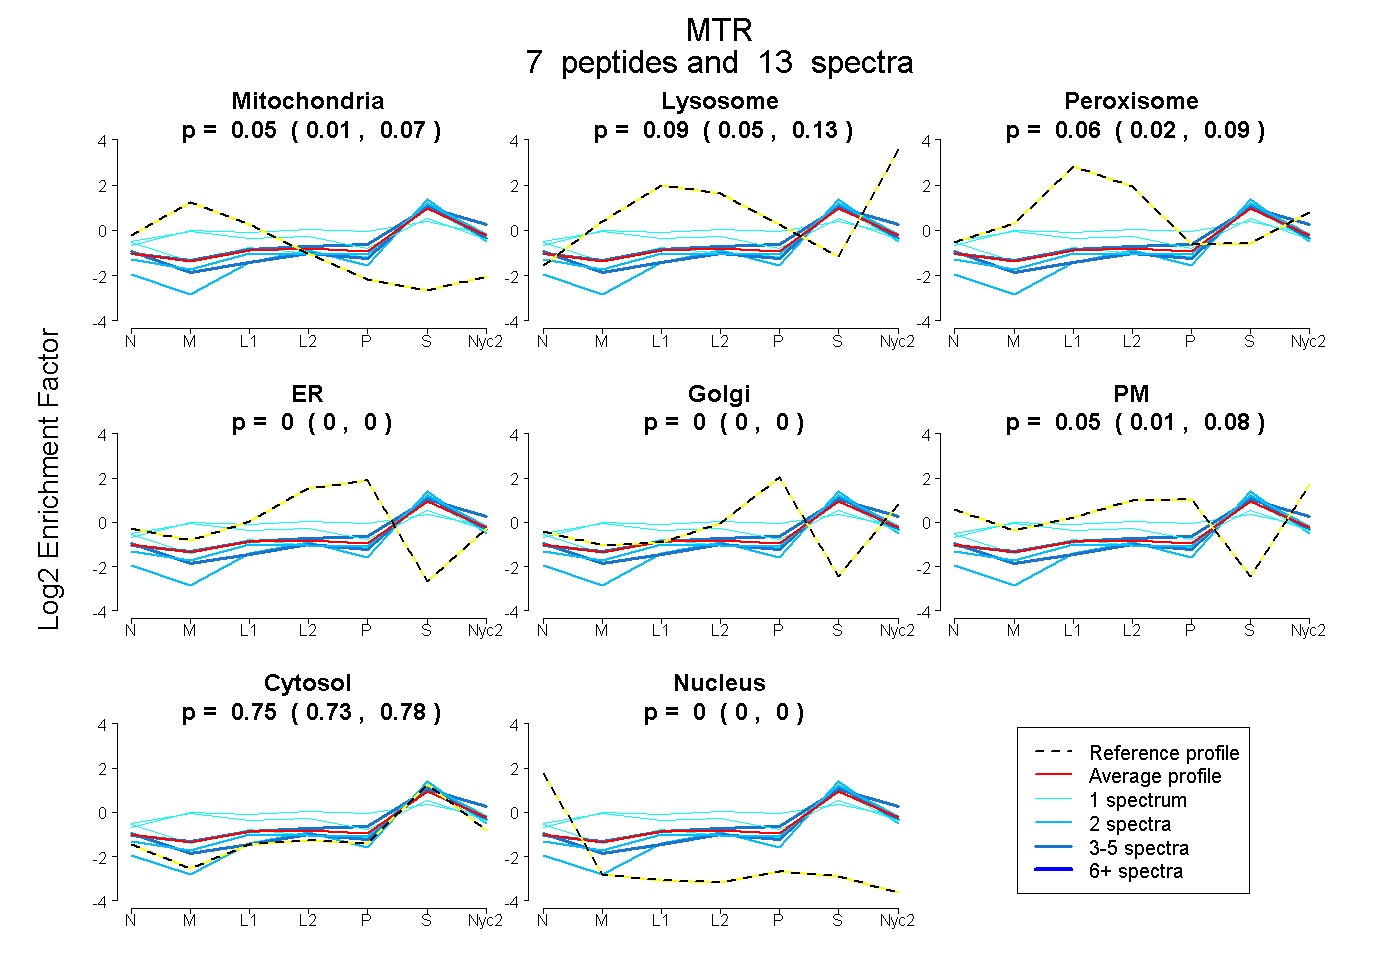
| Expt A |
7 peptides |
13 spectra |
|
0.046 0.014 | 0.074 |
0.094 0.053 | 0.129 |
0.057 0.020 | 0.088 |
0.000 0.000 | 0.000 |
0.000 0.000 | 0.001 |
0.050 0.008 | 0.081 |
0.754 0.729 | 0.775 |
0.000 0.000 | 0.000 |
| 1 spectrum, LANIEQATGIR | 0.182 | 0.018 | 0.228 | 0.000 | 0.000 | 0.084 | 0.487 | 0.000 | ||
| 2 spectra, EGEEDFLEK | 0.000 | 0.022 | 0.000 | 0.000 | 0.000 | 0.000 | 0.978 | 0.000 | ||
| 3 spectra, LAEAFAEELHER | 0.000 | 0.186 | 0.000 | 0.000 | 0.000 | 0.077 | 0.737 | 0.000 | ||
| 1 spectrum, GDVHDIGK | 0.074 | 0.000 | 0.113 | 0.000 | 0.000 | 0.066 | 0.747 | 0.000 | ||
| 1 spectrum, AVGEEAR | 0.083 | 0.000 | 0.341 | 0.000 | 0.193 | 0.000 | 0.383 | 0.000 | ||
| 2 spectra, LSEENFQGQEFK | 0.011 | 0.139 | 0.000 | 0.000 | 0.000 | 0.000 | 0.850 | 0.000 | ||
| 3 spectra, HIVEDTEEAR | 0.011 | 0.028 | 0.000 | 0.000 | 0.000 | 0.085 | 0.876 | 0.000 |
| Plot | Mito | Lyso or Perox | ER | Golgi | PM | Cytosol | Nucleus | ||||||
| Expt B |
1 peptide |
1 spectrum |
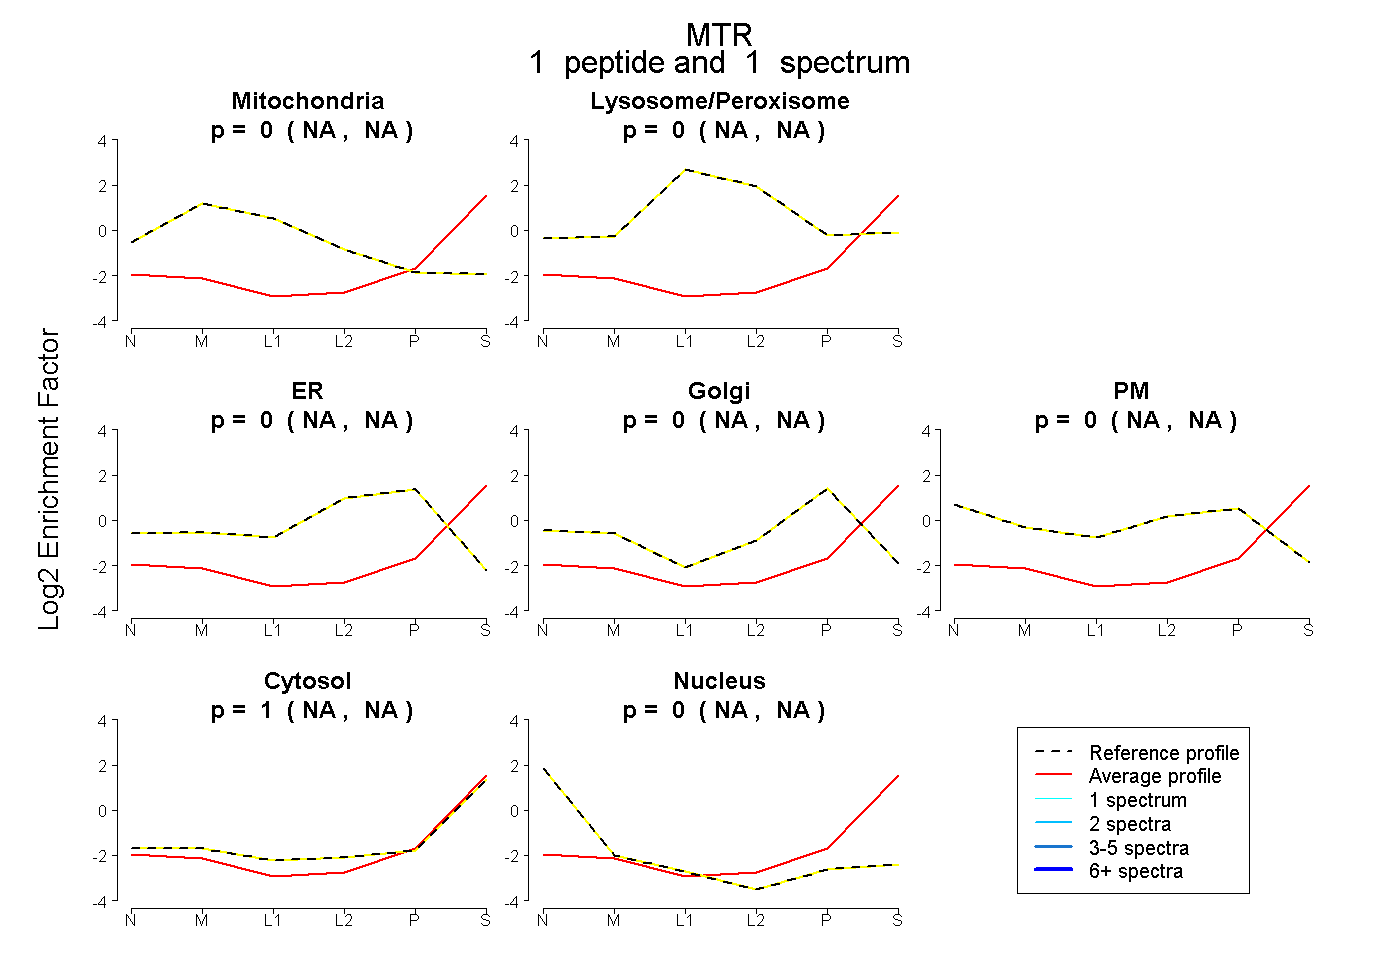 |
0.000 NA | NA |
0.000 NA | NA |
0.000 NA | NA |
0.000 NA | NA |
0.000 NA | NA |
1.000 NA | NA |
0.000 NA | NA |
|||
| Plot | Lyso | Other | |||||||||||
| Expt C |
5 peptides |
12 spectra |
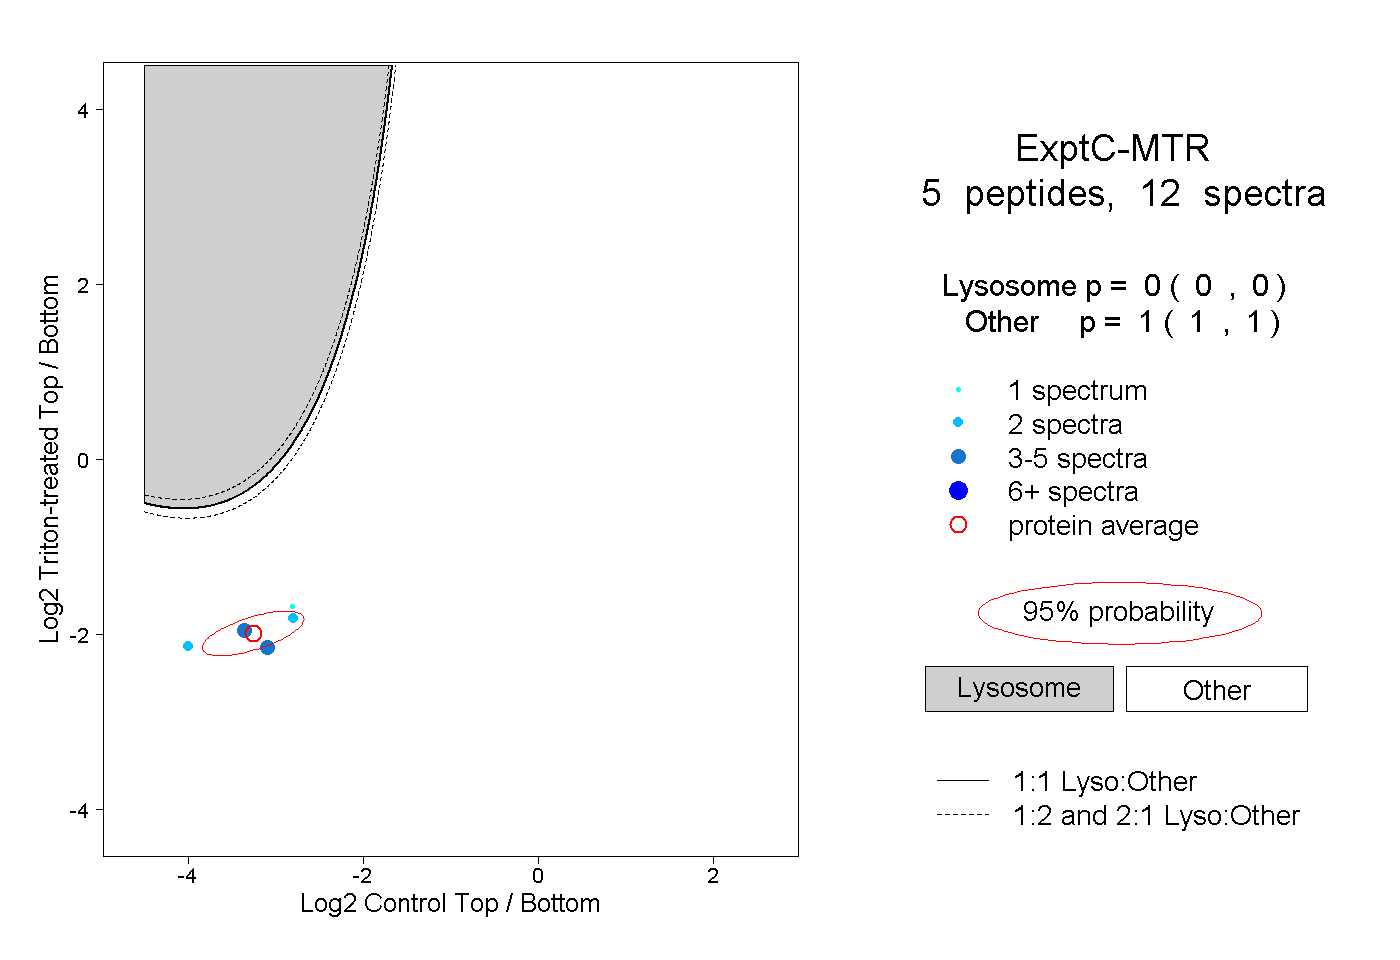 |
0.000 0.000 | 0.000 |
1.000 1.000 | 1.000 |