 7
7peptides
spectra
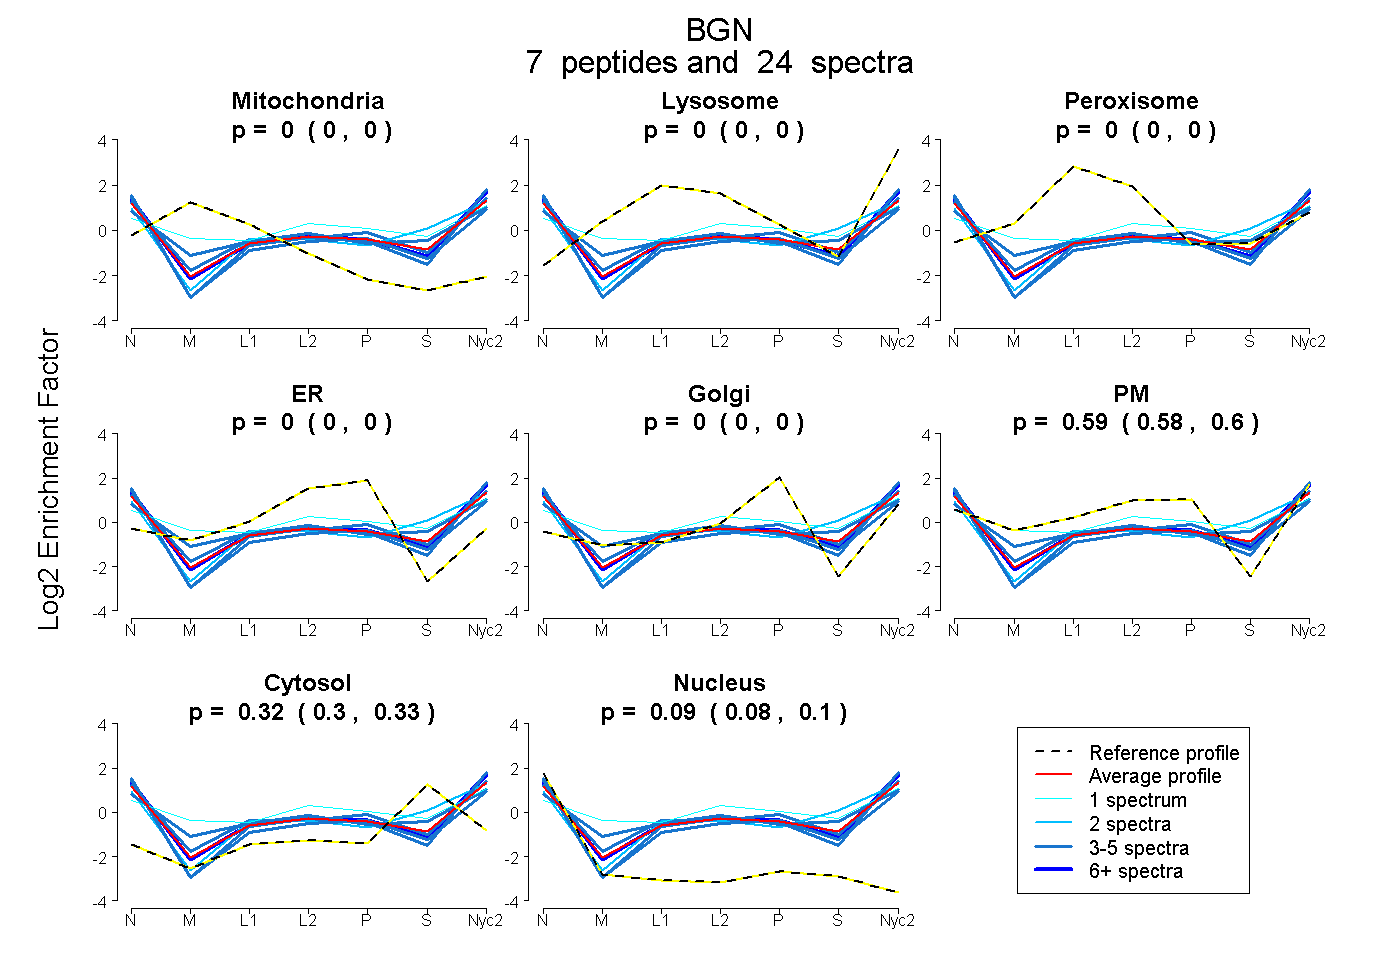
0.000 | 0.000
0.000 | 0.000
0.000 | 0.000
0.000 | 0.000
0.000 | 0.000
0.581 | 0.601
0.303 | 0.332
0.079 | 0.097
3peptides
spectra
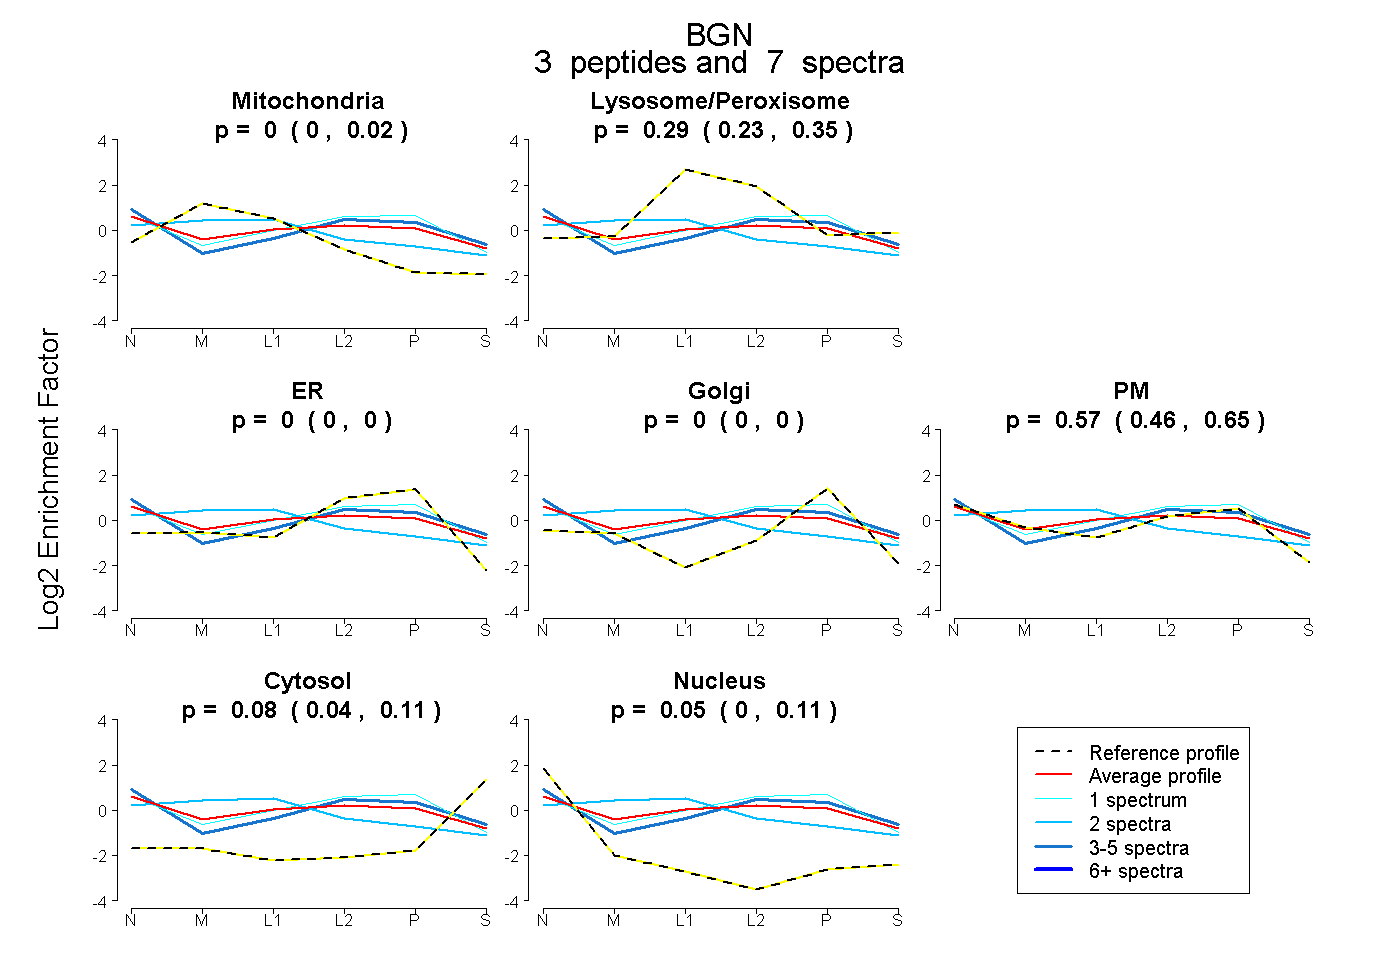
0.000 | 0.018
0.231 | 0.352
0.000 | 0.000
0.000 | 0.000
0.456 | 0.654
0.041 | 0.111
0.000 | 0.112
11peptides
spectra
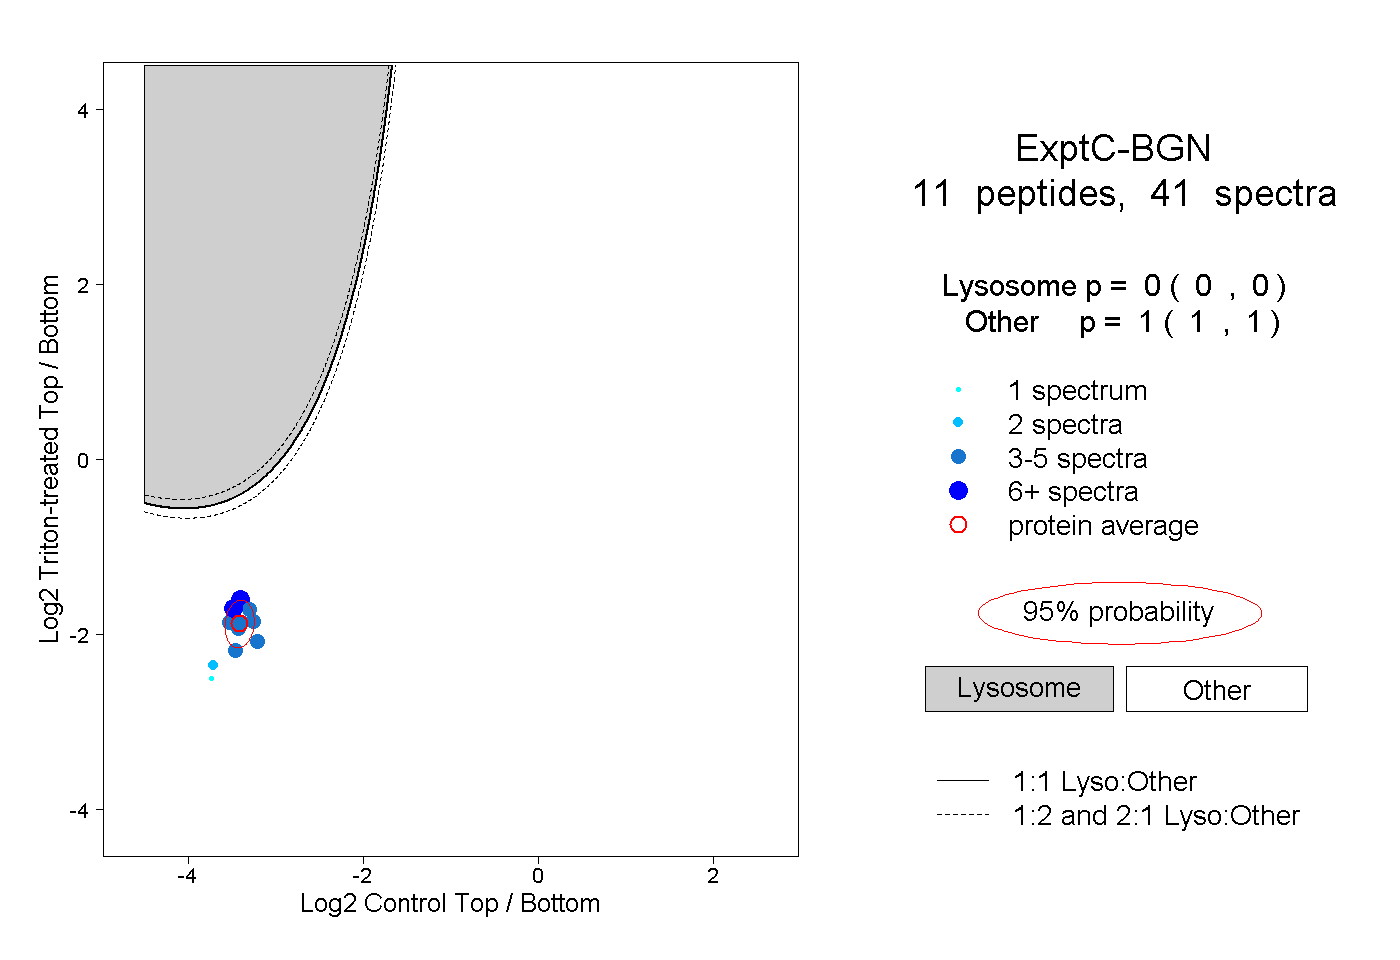
0.000 | 0.000
1.000 | 1.000
5peptides
spectra
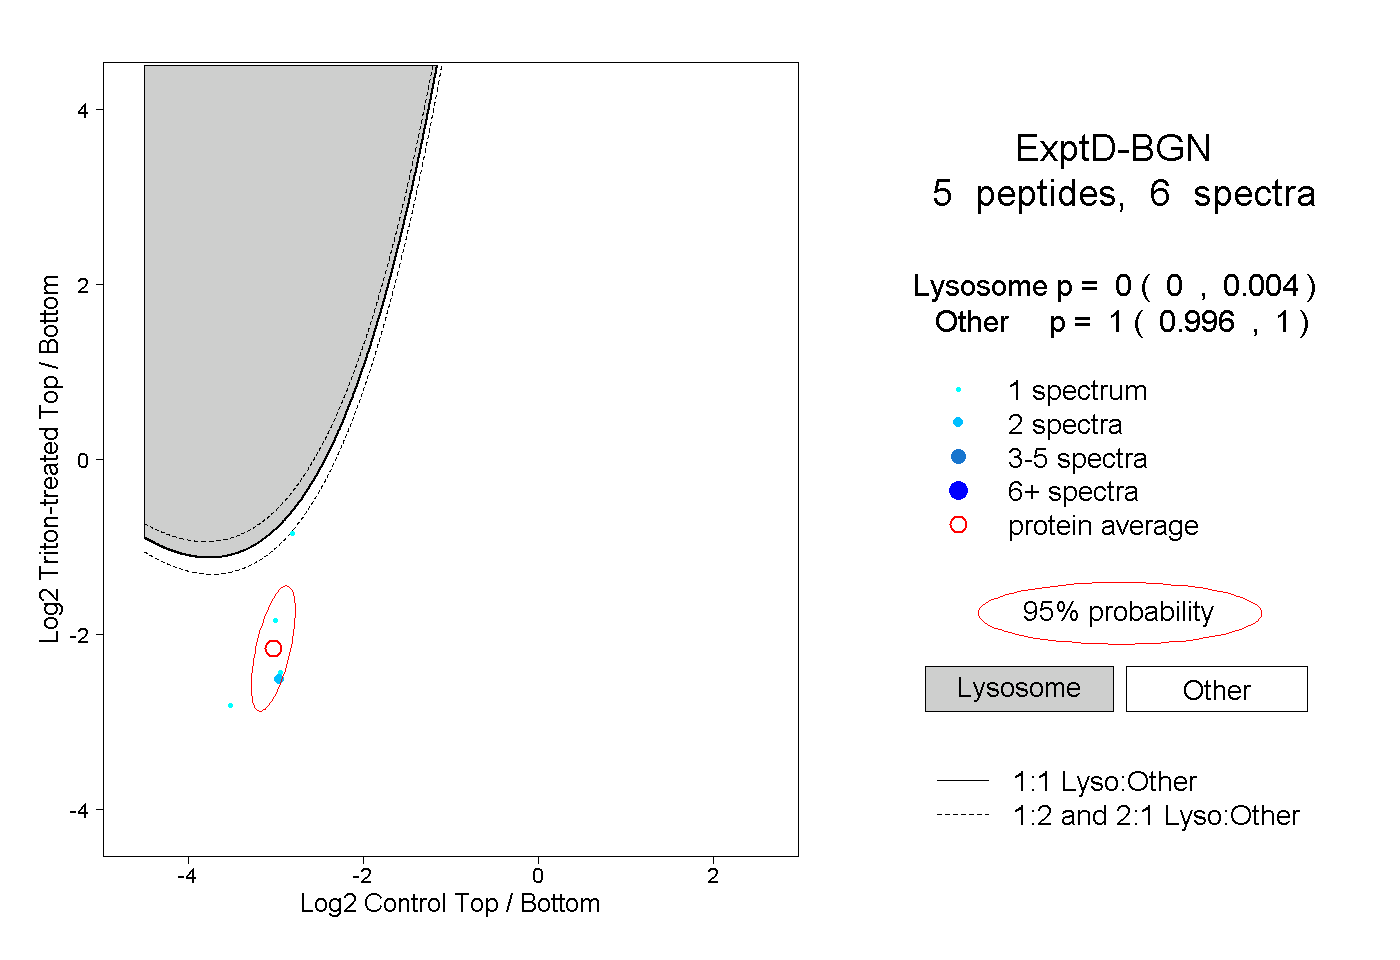
0.000 | 0.004
0.996 | 1.000