 7
7peptides
spectra
0.000 | 0.000
0.000 | 0.000
0.000 | 0.000
0.000 | 0.000
0.000 | 0.000
0.581 | 0.601
0.303 | 0.332
0.079 | 0.097
| Plot | Mito | Lyso | Perox | ER | Golgi | PM | Cytosol | Nucleus | |||||
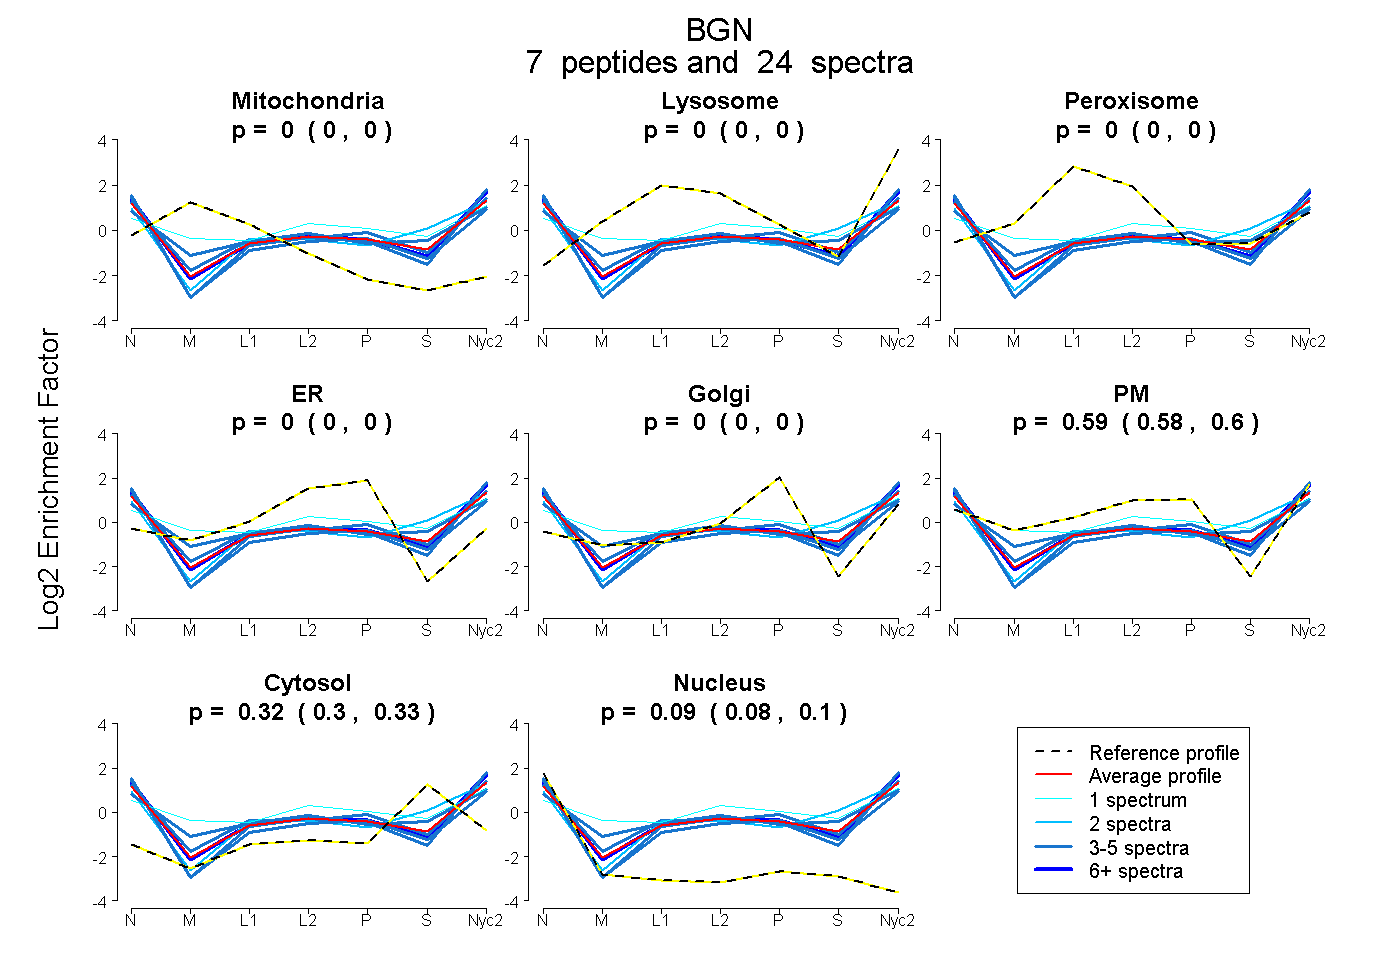
| Expt A |
7 peptides |
24 spectra |
|
0.000 0.000 | 0.000 |
0.000 0.000 | 0.000 |
0.000 0.000 | 0.000 |
0.000 0.000 | 0.000 |
0.000 0.000 | 0.000 |
0.593 0.581 | 0.601 |
0.319 0.303 | 0.332 |
0.089 0.079 | 0.097 |
| 2 spectra, GVFSGLR | 0.000 | 0.000 | 0.000 | 0.000 | 0.000 | 0.461 | 0.531 | 0.007 | ||
| 1 spectrum, NHLVEIPPNLPSSLVELR | 0.000 | 0.001 | 0.082 | 0.000 | 0.000 | 0.586 | 0.331 | 0.000 | ||
| 5 spectra, LGLGHNQIR | 0.000 | 0.000 | 0.058 | 0.000 | 0.000 | 0.526 | 0.363 | 0.053 | ||
| 3 spectra, IQAIELEDLLR | 0.000 | 0.000 | 0.000 | 0.000 | 0.000 | 0.635 | 0.209 | 0.156 | ||
| 3 spectra, DLPETLNELHLDHNK | 0.000 | 0.000 | 0.000 | 0.000 | 0.000 | 0.647 | 0.271 | 0.082 | ||
| 6 spectra, AFSPLR | 0.000 | 0.000 | 0.000 | 0.000 | 0.000 | 0.647 | 0.252 | 0.101 | ||
| 4 spectra, VVQCSDLGLK | 0.000 | 0.000 | 0.000 | 0.000 | 0.000 | 0.536 | 0.260 | 0.204 |
| Plot | Mito | Lyso or Perox | ER | Golgi | PM | Cytosol | Nucleus | ||||||
| Expt B |
3 peptides |
7 spectra |
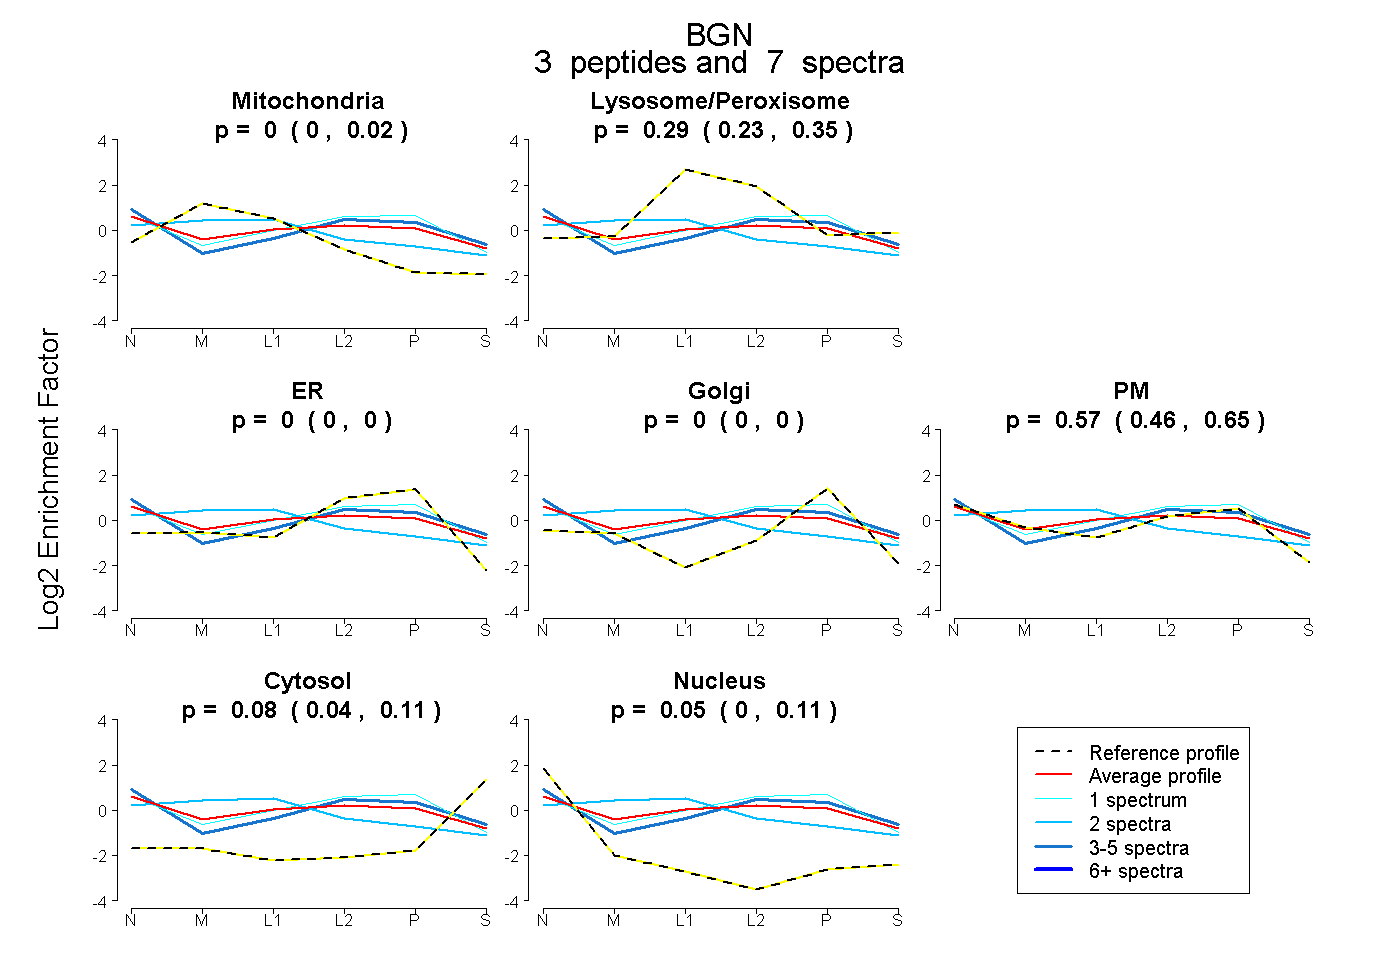 |
0.000 0.000 | 0.018 |
0.294 0.231 | 0.352 |
0.000 0.000 | 0.000 |
0.000 0.000 | 0.000 |
0.571 0.456 | 0.654 |
0.081 0.041 | 0.111 |
0.054 0.000 | 0.112 |
|||
| Plot | Lyso | Other | |||||||||||
| Expt C |
11 peptides |
41 spectra |
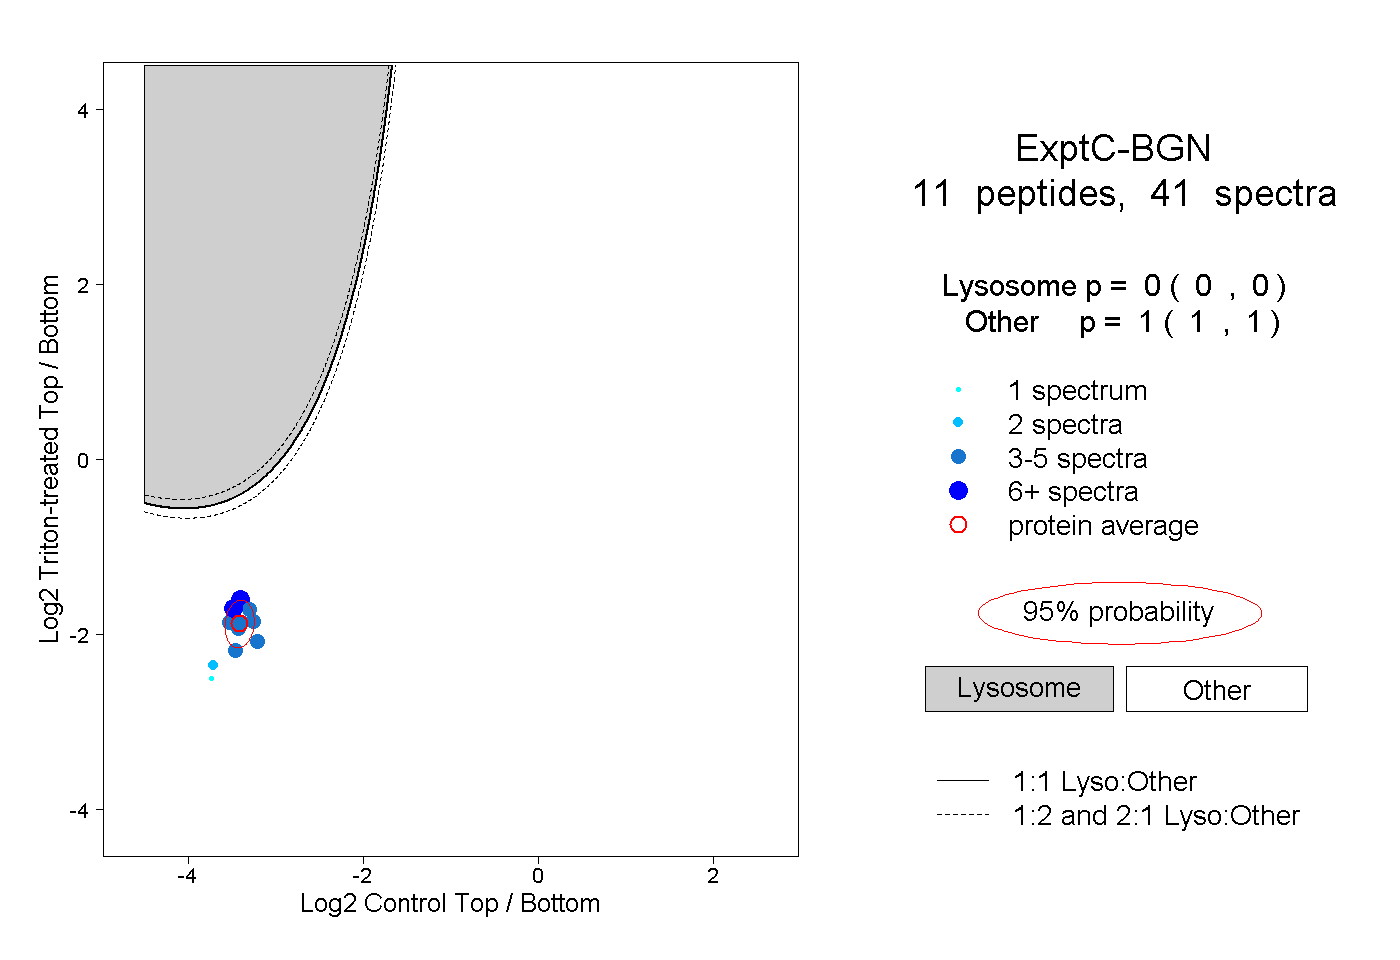 |
0.000 0.000 | 0.000 |
1.000 1.000 | 1.000 |
||||||||
| Plot | Lyso | Other | |||||||||||
| Expt D |
5 peptides |
6 spectra |
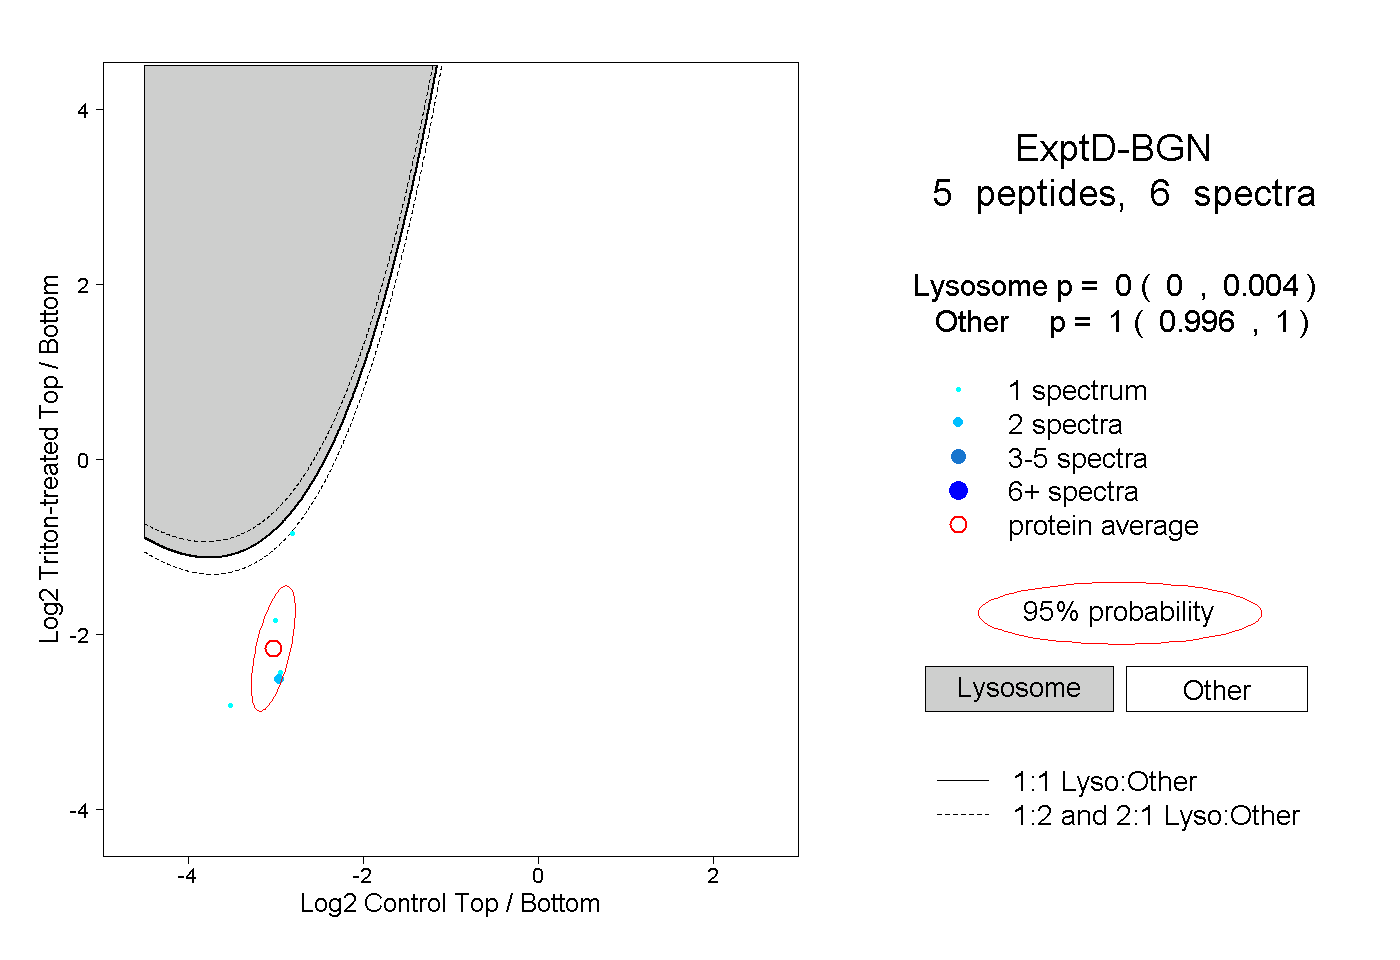 |
0.000 0.000 | 0.004 |
1.000 0.996 | 1.000 |