 3
3peptides
spectra
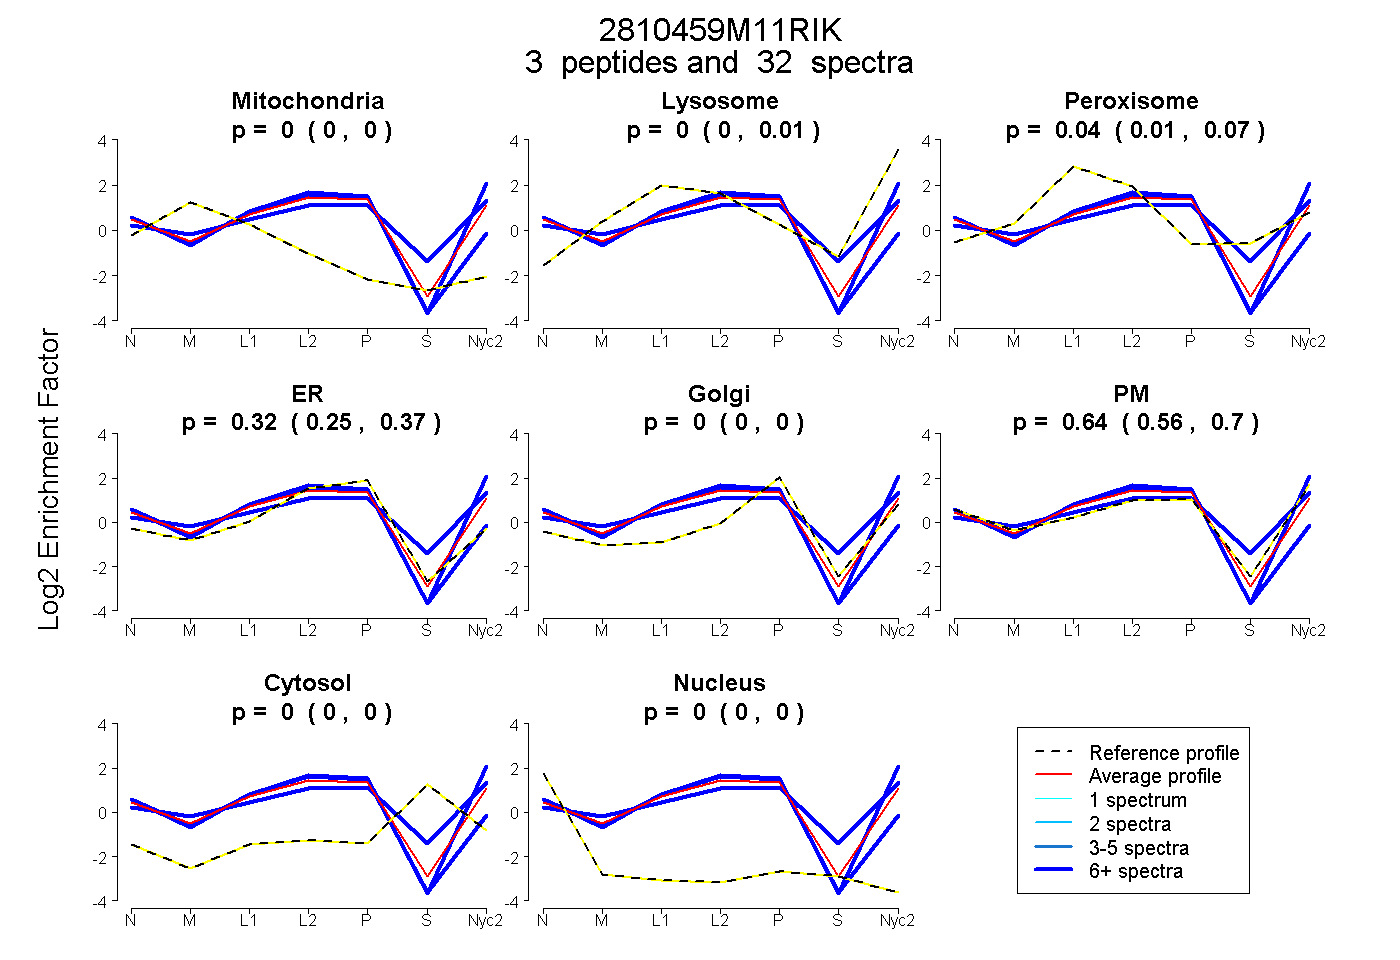
0.000 | 0.000
0.000 | 0.012
0.006 | 0.069
0.250 | 0.374
0.000 | 0.000
0.563 | 0.701
0.000 | 0.000
0.000 | 0.000
1peptide
spectra
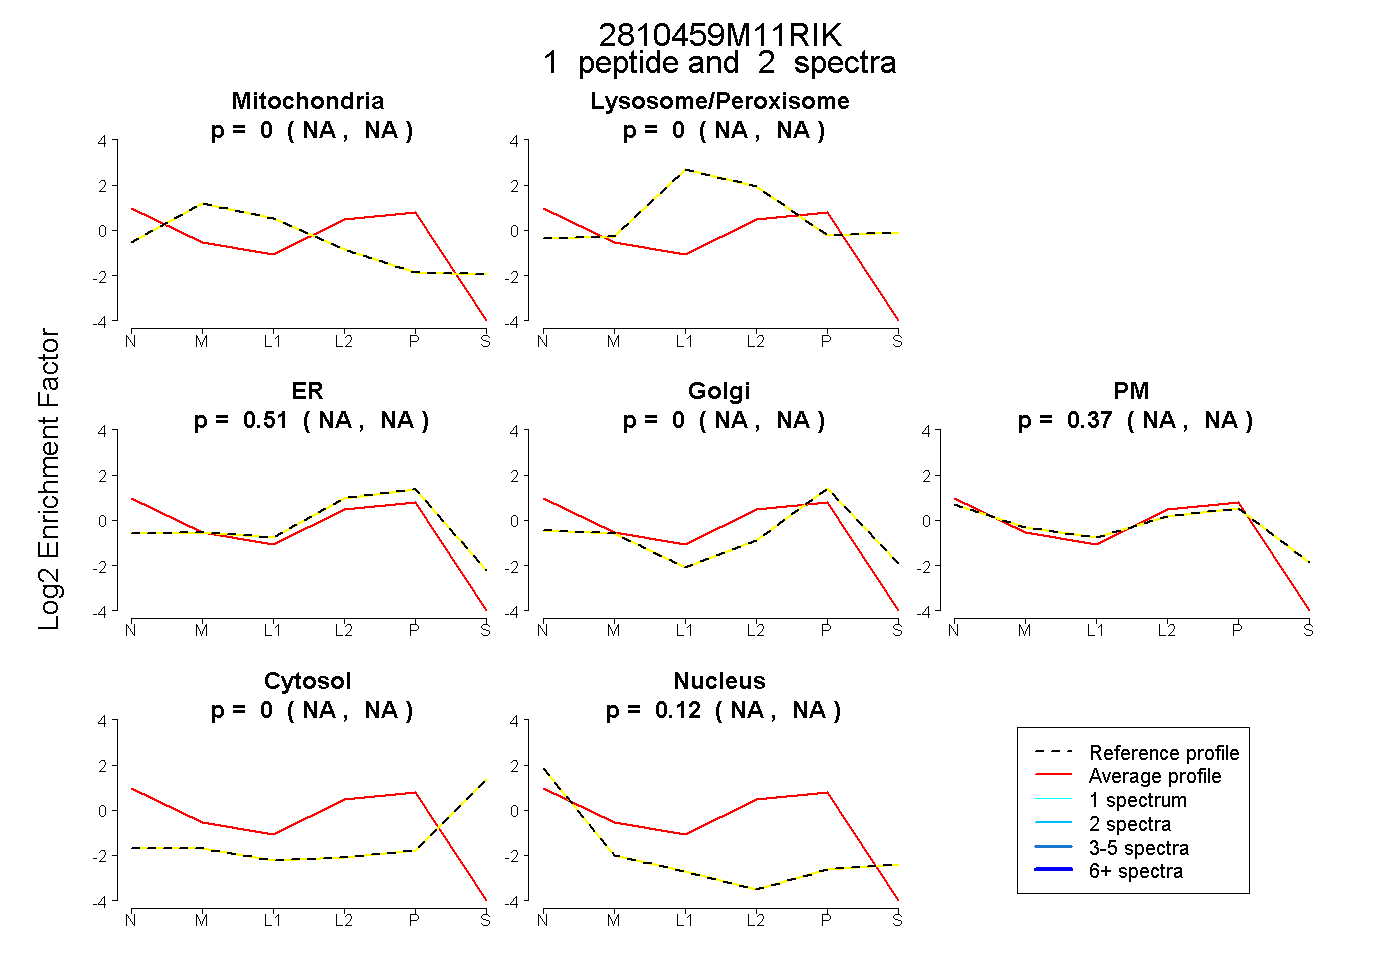
NA | NA
NA | NA
NA | NA
NA | NA
NA | NA
NA | NA
NA | NA
4peptides
spectra
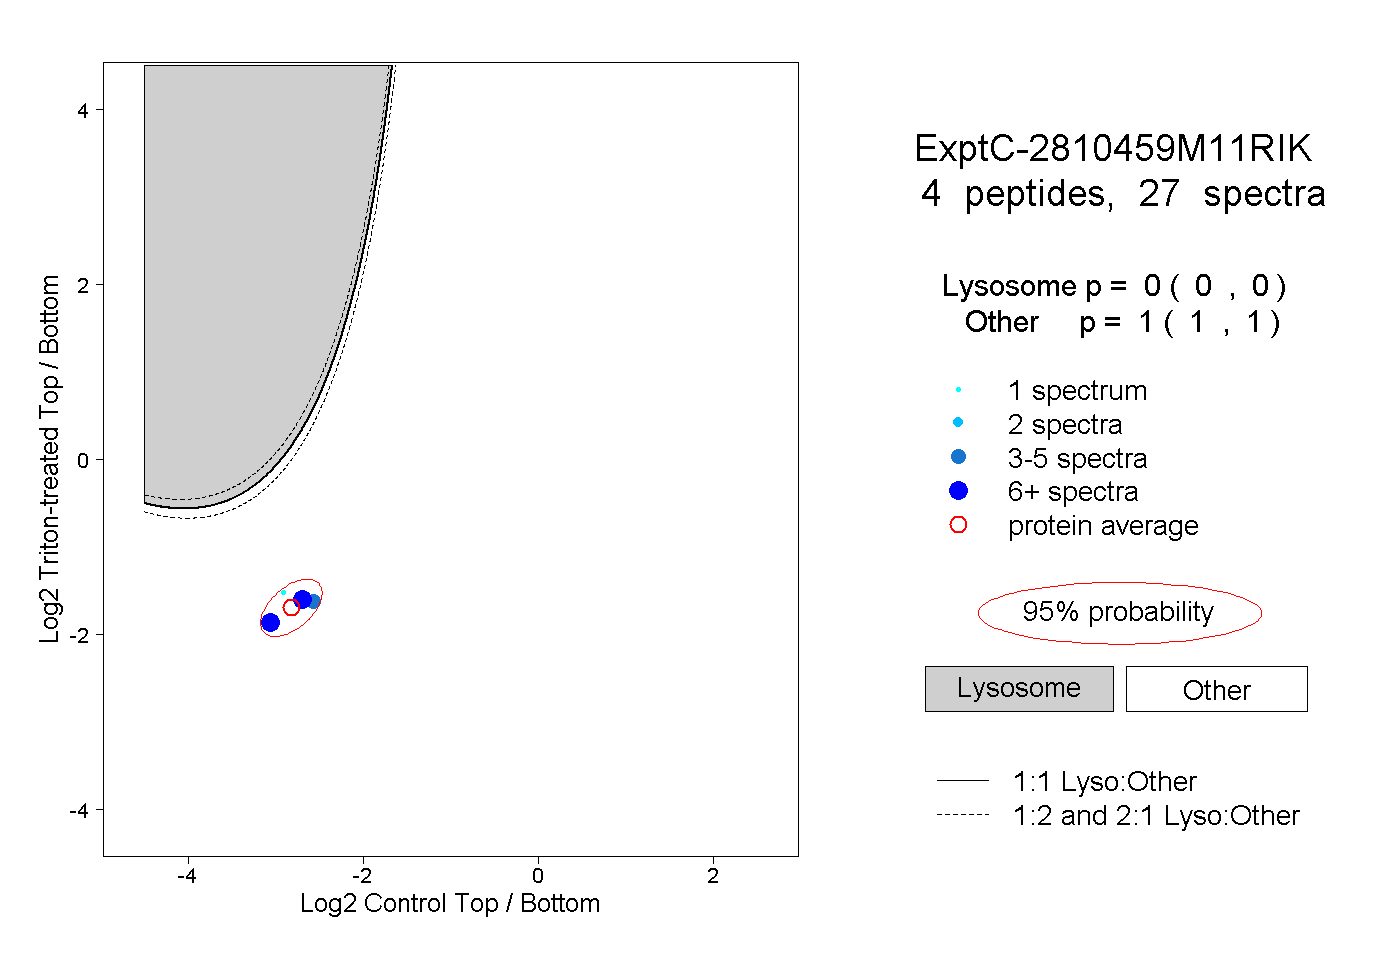
0.000 | 0.000
1.000 | 1.000