 3
3peptides
spectra
0.000 | 0.000
0.000 | 0.012
0.006 | 0.069
0.250 | 0.374
0.000 | 0.000
0.563 | 0.701
0.000 | 0.000
0.000 | 0.000
| Plot | Mito | Lyso | Perox | ER | Golgi | PM | Cytosol | Nucleus | |||||
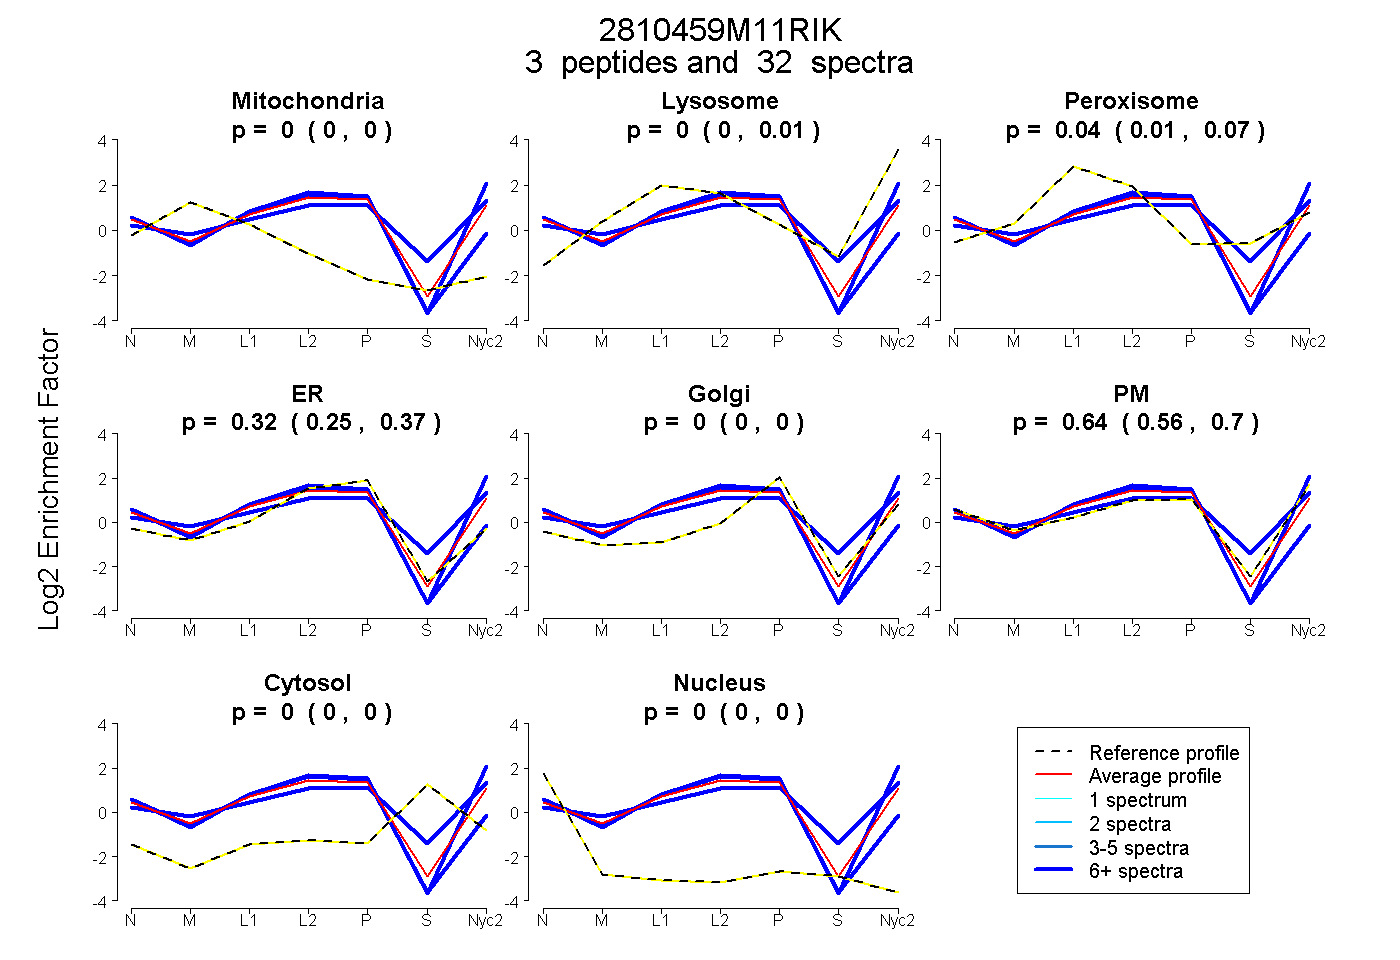
| Expt A |
3 peptides |
32 spectra |
|
0.000 0.000 | 0.000 |
0.000 0.000 | 0.012 |
0.043 0.006 | 0.069 |
0.316 0.250 | 0.374 |
0.000 0.000 | 0.000 |
0.641 0.563 | 0.701 |
0.000 0.000 | 0.000 |
0.000 0.000 | 0.000 |
| 14 spectra, SPLVFVLCR | 0.047 | 0.000 | 0.000 | 0.741 | 0.000 | 0.212 | 0.000 | 0.000 | ||
| 12 spectra, GQVLLVGELWER | 0.000 | 0.010 | 0.000 | 0.064 | 0.000 | 0.926 | 0.000 | 0.000 | ||
| 6 spectra, AQDGVVHMPPDPLGNTR | 0.000 | 0.027 | 0.230 | 0.000 | 0.189 | 0.525 | 0.029 | 0.000 |
| Plot | Mito | Lyso or Perox | ER | Golgi | PM | Cytosol | Nucleus | ||||||
| Expt B |
1 peptide |
2 spectra |
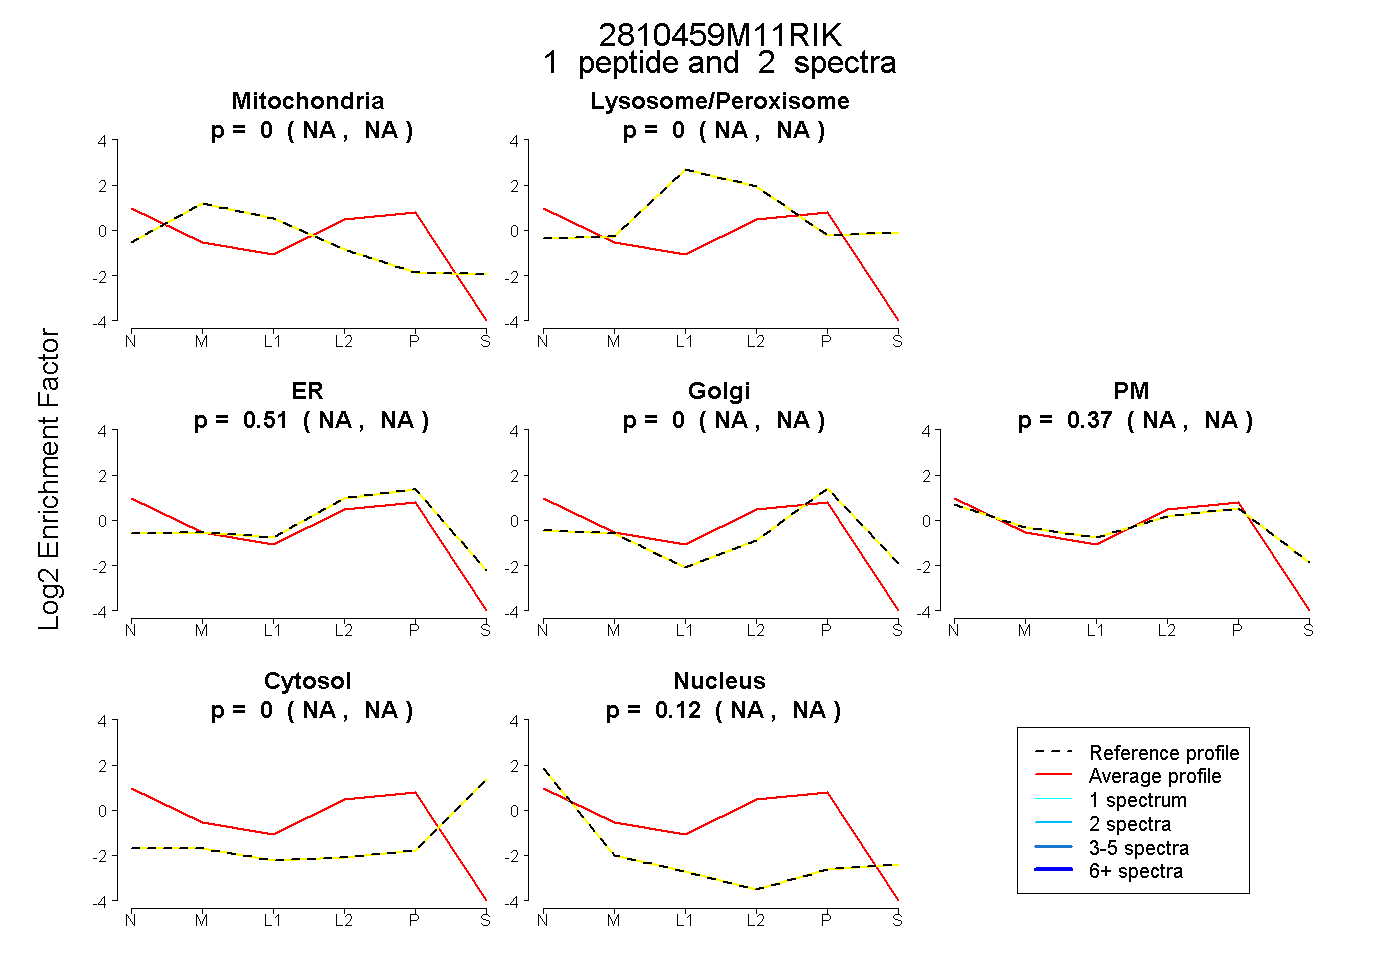 |
0.000 NA | NA |
0.000 NA | NA |
0.513 NA | NA |
0.000 NA | NA |
0.371 NA | NA |
0.000 NA | NA |
0.116 NA | NA |
|||
| Plot | Lyso | Other | |||||||||||
| Expt C |
4 peptides |
27 spectra |
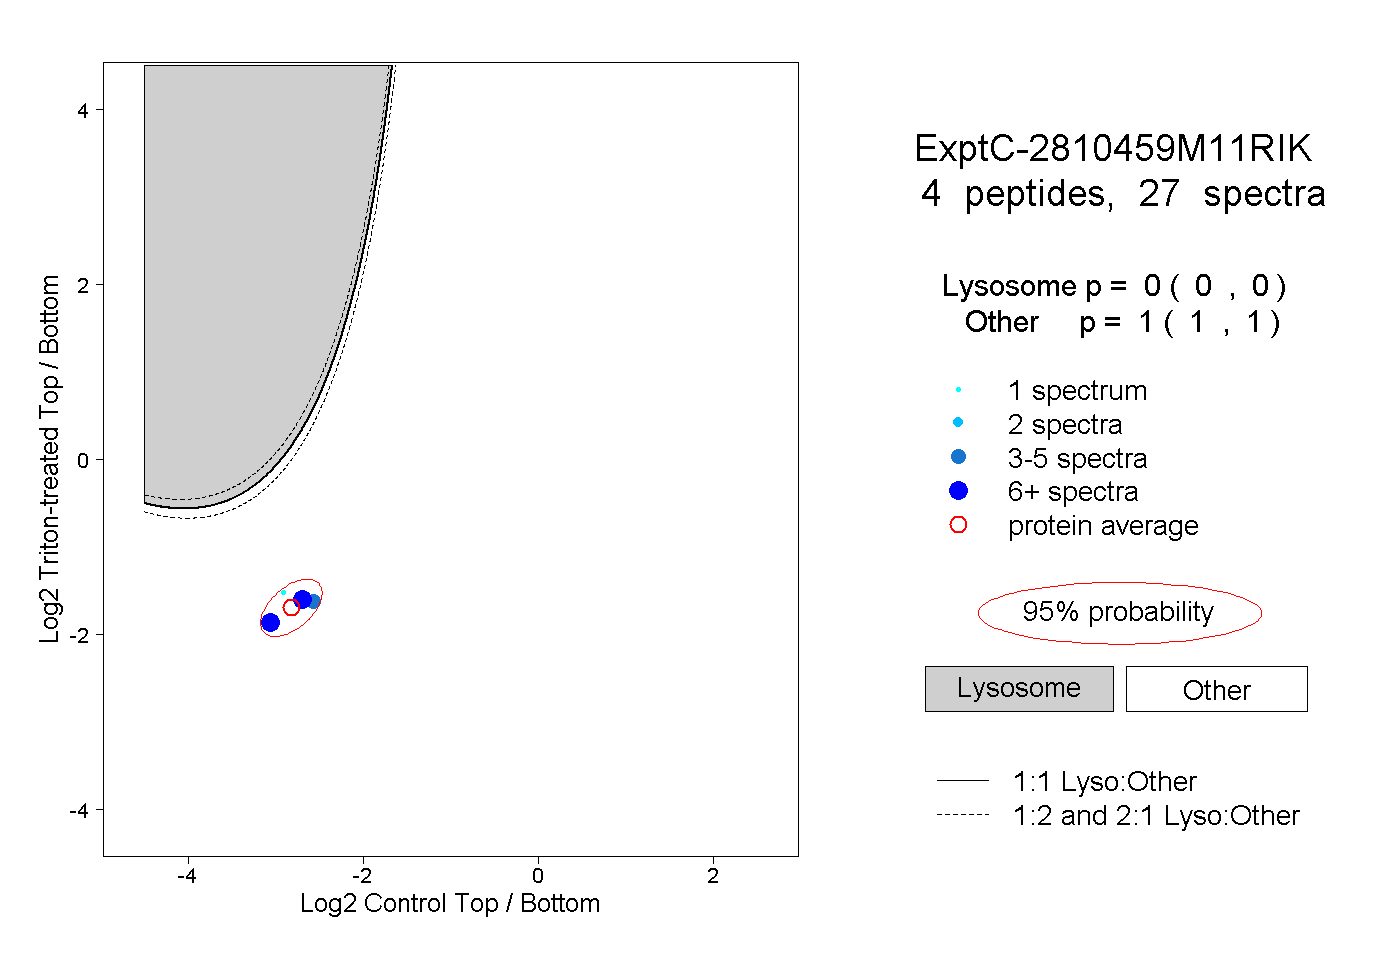 |
0.000 0.000 | 0.000 |
1.000 1.000 | 1.000 |