 2
2peptides
spectra
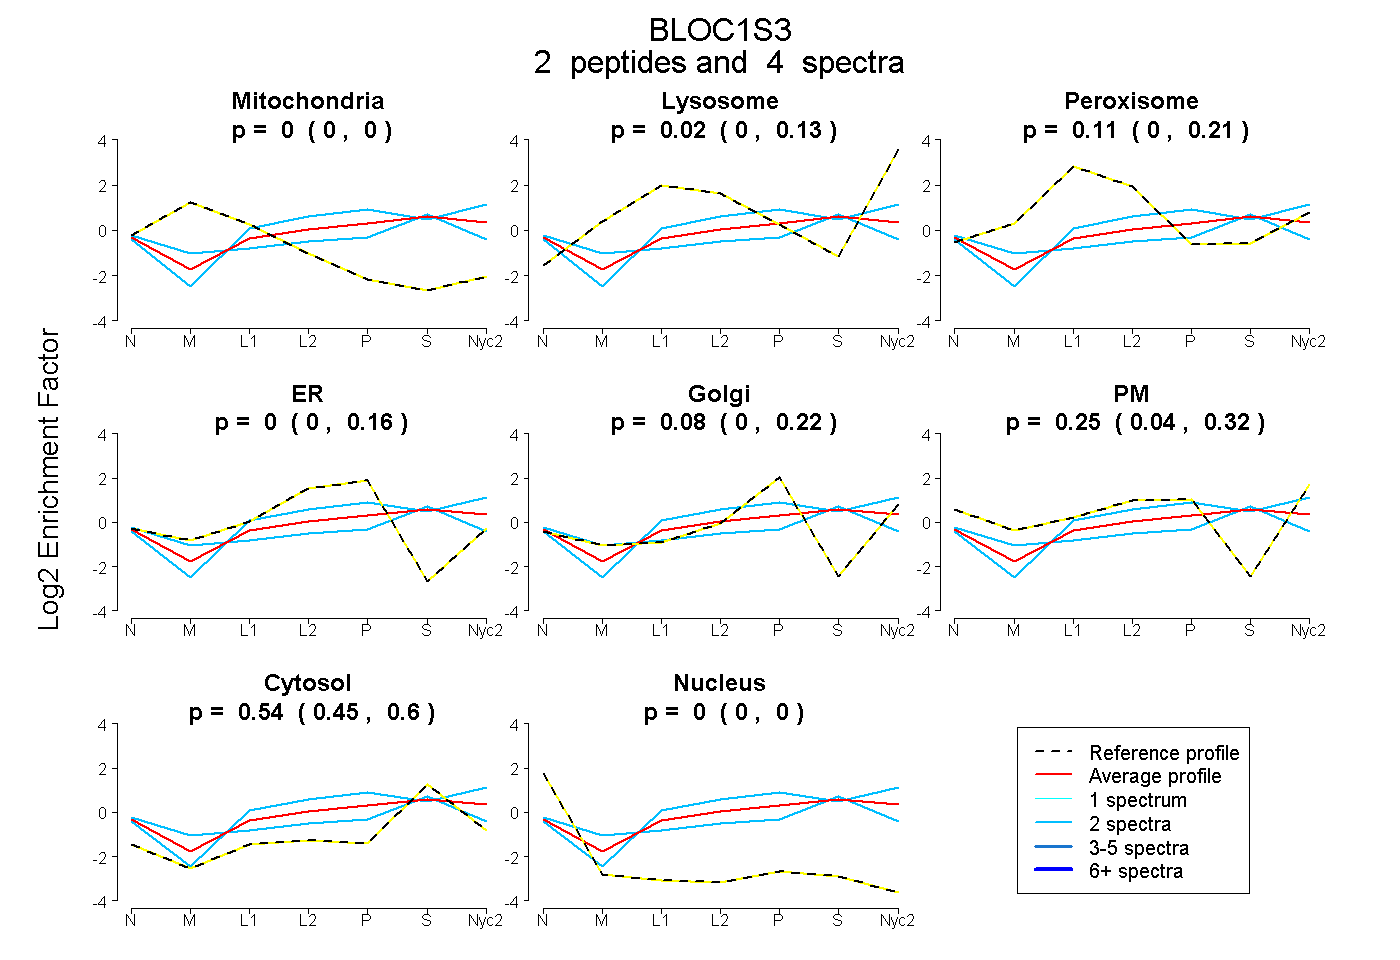
0.000 | 0.000
0.000 | 0.131
0.000 | 0.214
0.000 | 0.156
0.000 | 0.217
0.035 | 0.320
0.453 | 0.604
0.000 | 0.000
1peptide
spectrum
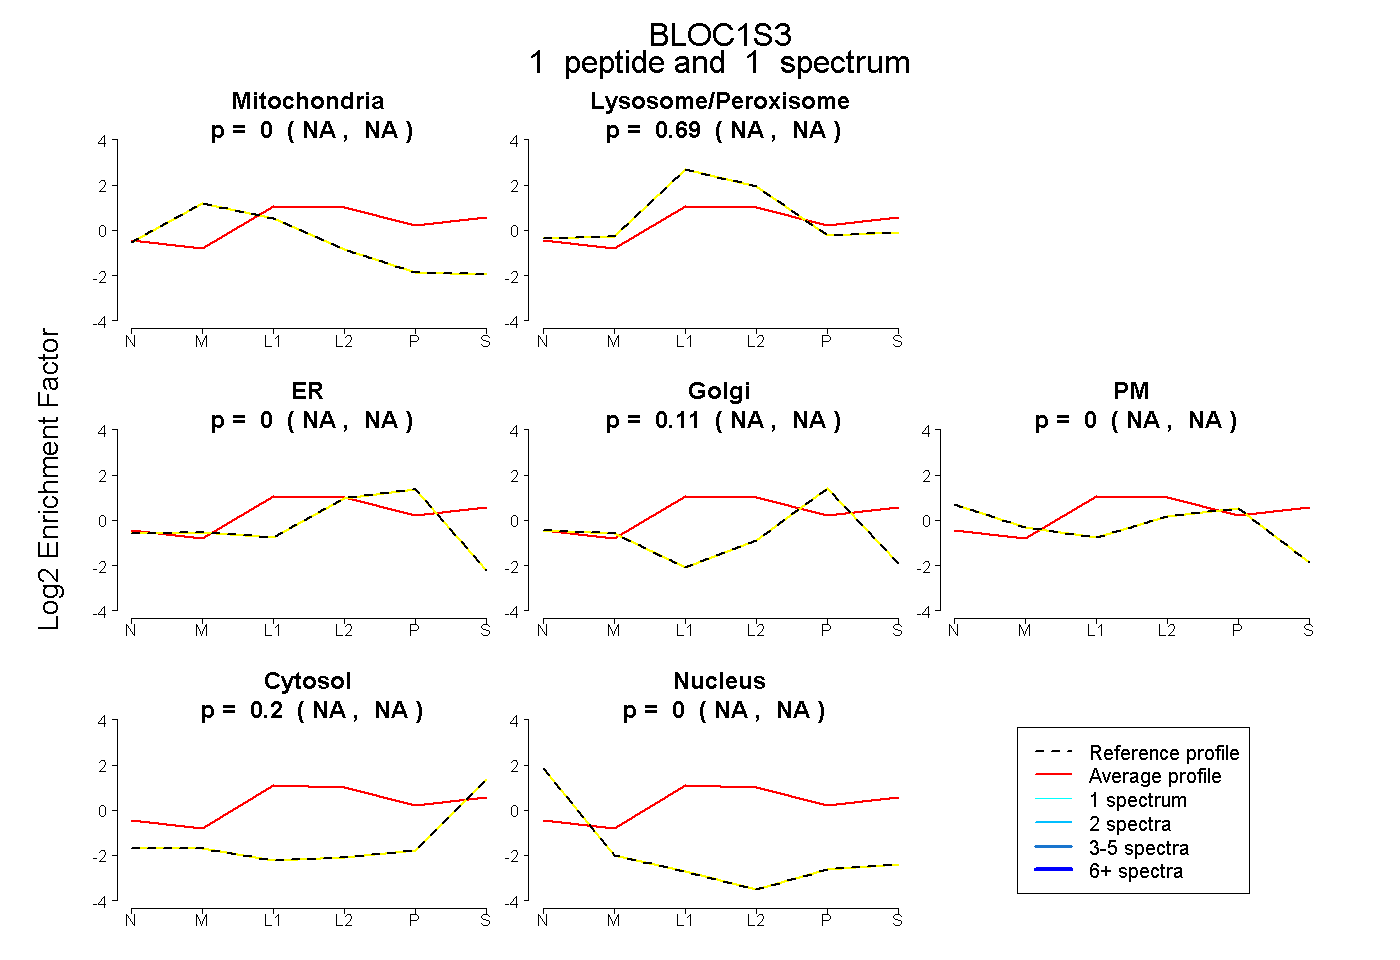
NA | NA
NA | NA
NA | NA
NA | NA
NA | NA
NA | NA
NA | NA
3peptides
spectra
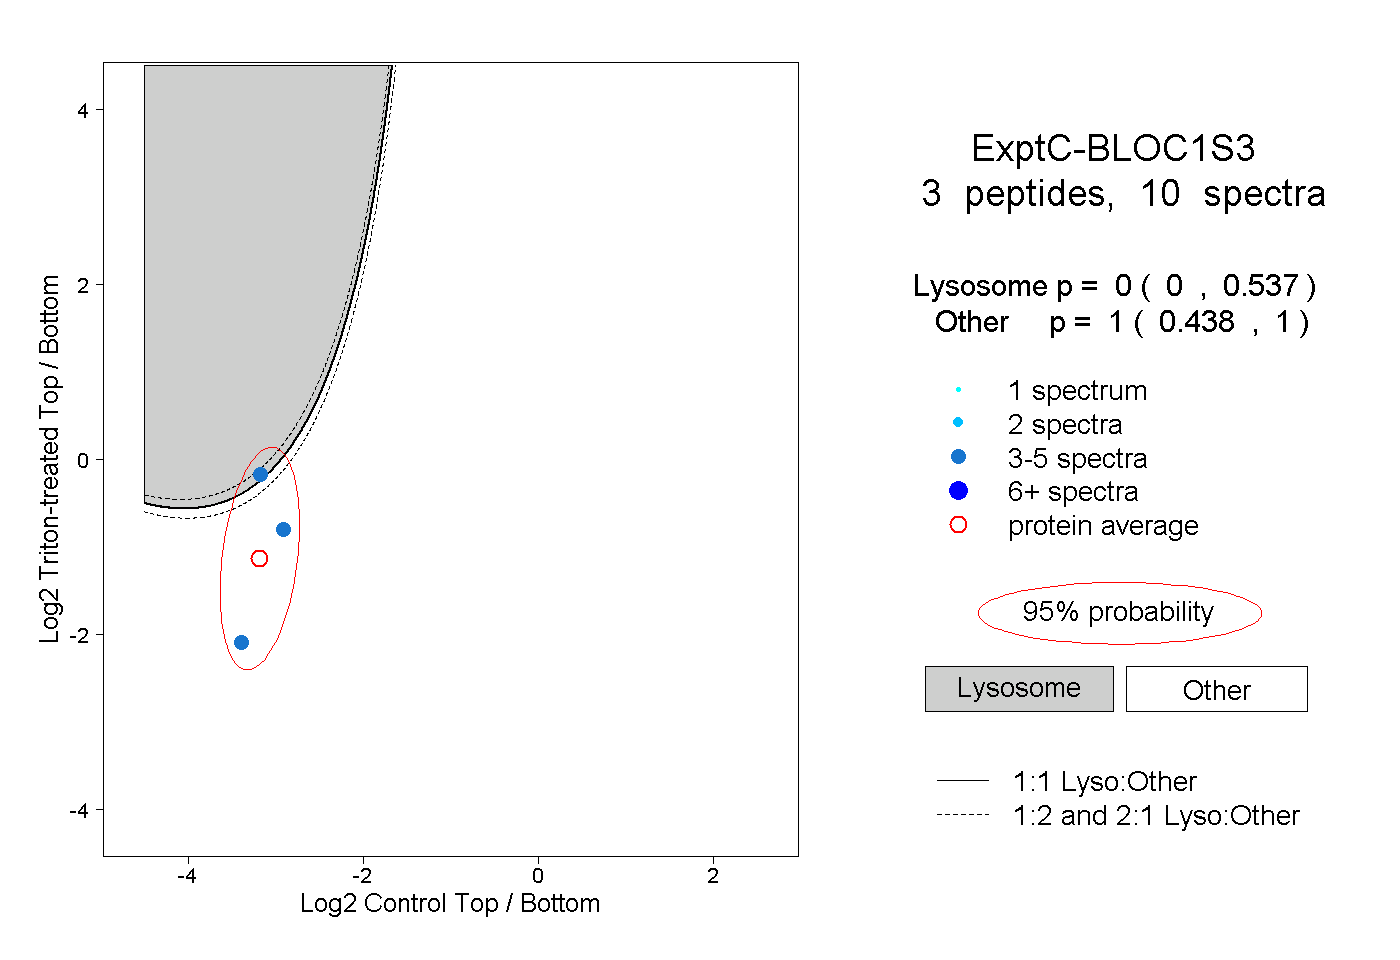
0.000 | 0.537
0.438 | 1.000