 2
2peptides
spectra
0.000 | 0.000
0.000 | 0.131
0.000 | 0.214
0.000 | 0.156
0.000 | 0.217
0.035 | 0.320
0.453 | 0.604
0.000 | 0.000
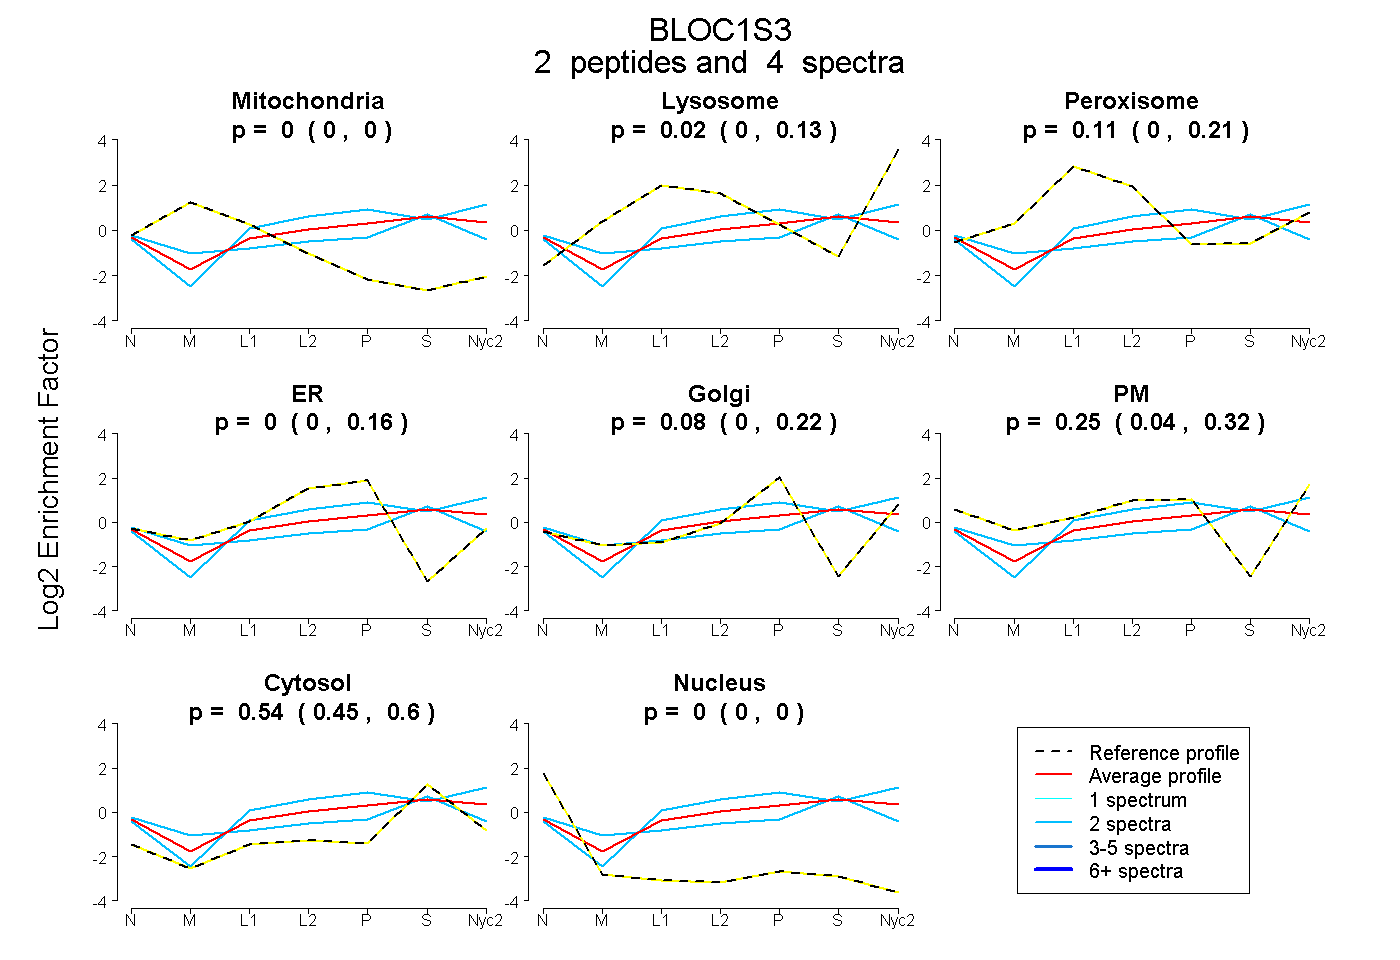
| Plot | Mito | Lyso | Perox | ER | Golgi | PM | Cytosol | Nucleus | |||||
| Expt A |
2 peptides |
4 spectra |
|
0.000 0.000 | 0.000 |
0.023 0.000 | 0.131 |
0.112 0.000 | 0.214 |
0.000 0.000 | 0.156 |
0.078 0.000 | 0.217 |
0.249 0.035 | 0.320 |
0.538 0.453 | 0.604 |
0.000 0.000 | 0.000 |
| 2 spectra, GDLCALAER | 0.041 | 0.000 | 0.077 | 0.003 | 0.000 | 0.244 | 0.635 | 0.000 | ||
| 2 spectra, LAAAQAIGLAAAHSVR | 0.000 | 0.236 | 0.000 | 0.130 | 0.063 | 0.119 | 0.452 | 0.000 |
| Plot | Mito | Lyso or Perox | ER | Golgi | PM | Cytosol | Nucleus | ||||||
| Expt B |
1 peptide |
1 spectrum |
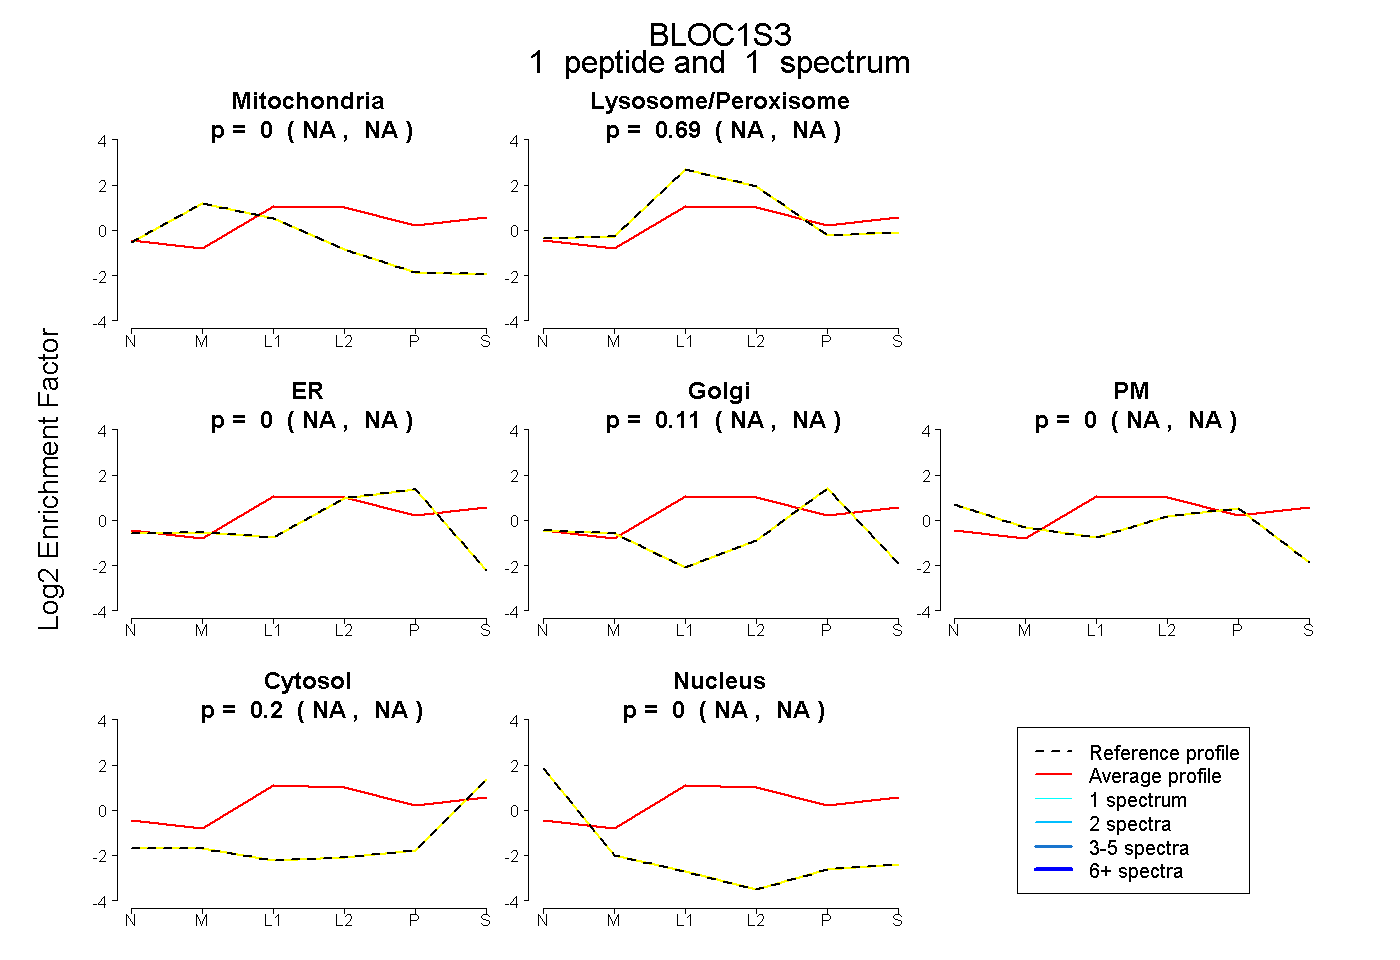 |
0.000 NA | NA |
0.690 NA | NA |
0.000 NA | NA |
0.111 NA | NA |
0.000 NA | NA |
0.199 NA | NA |
0.000 NA | NA |
|||
| Plot | Lyso | Other | |||||||||||
| Expt C |
3 peptides |
10 spectra |
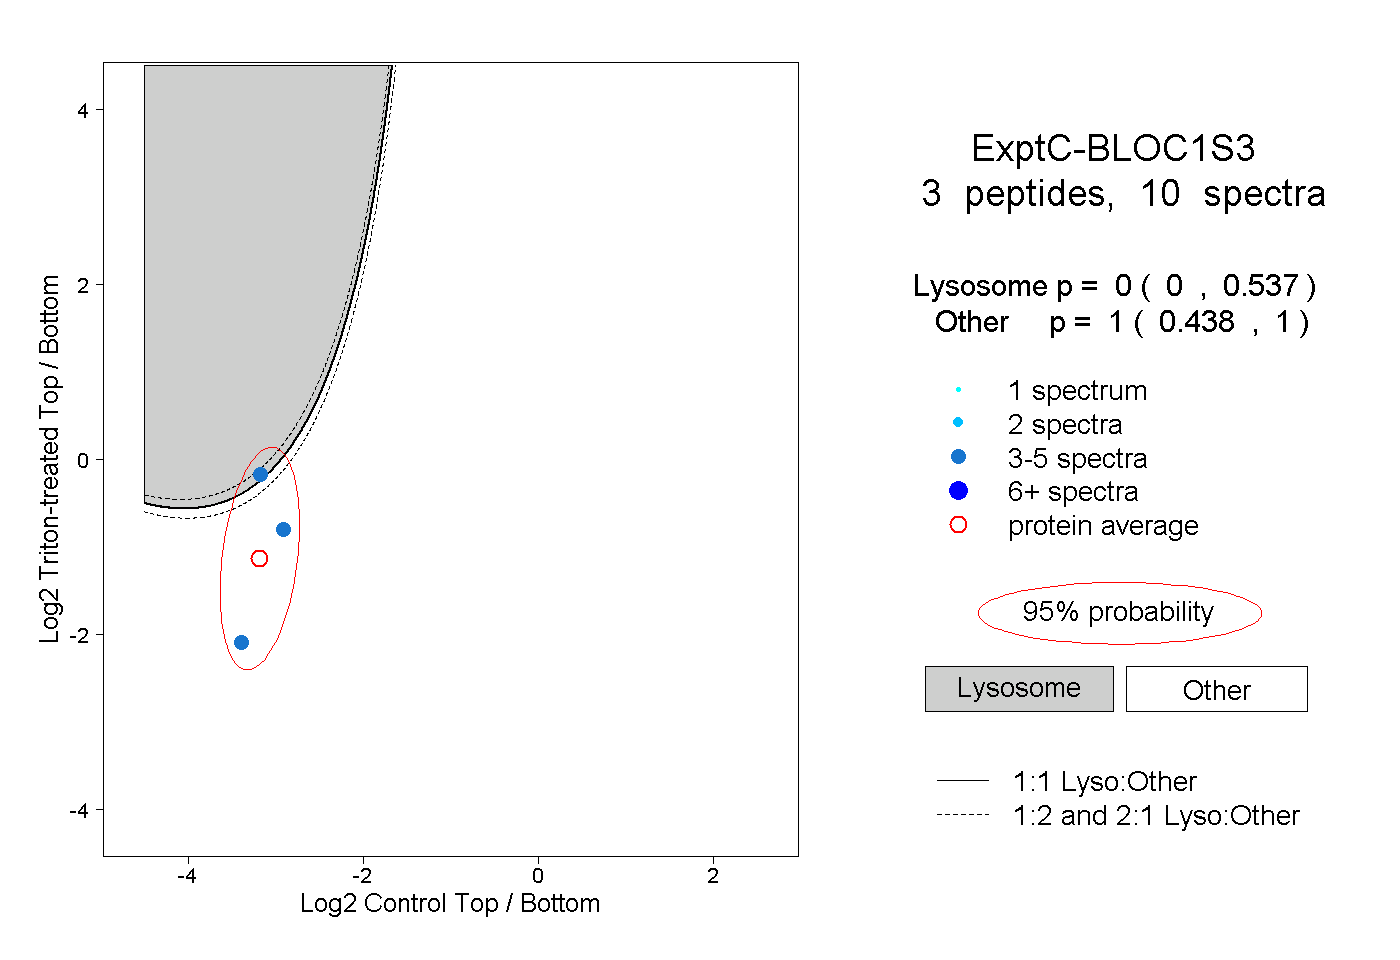 |
0.000 0.000 | 0.537 |
1.000 0.438 | 1.000 |