 9
9peptides
spectra
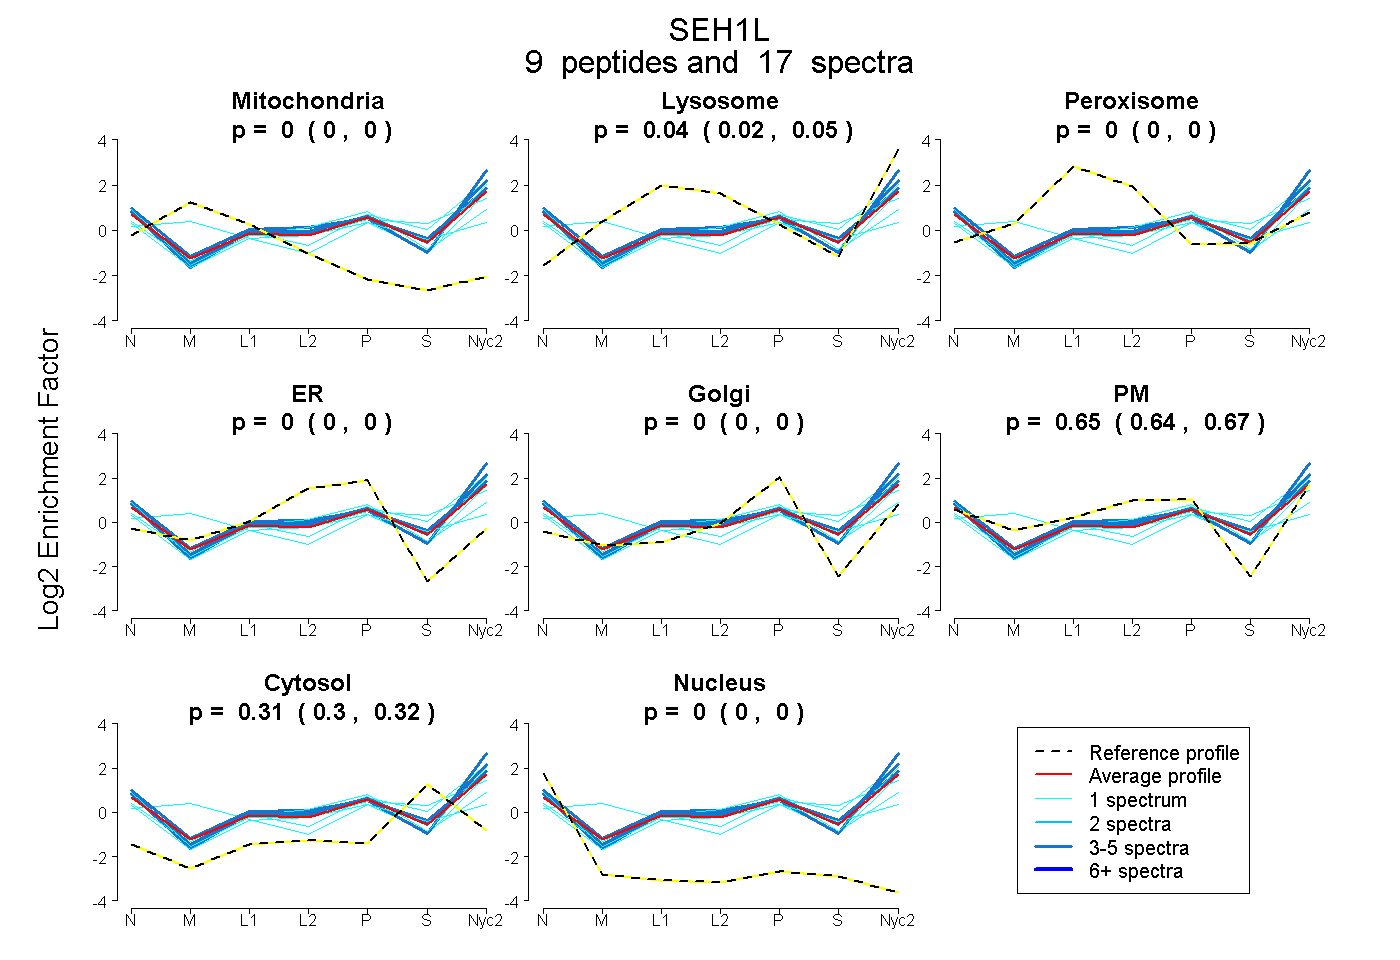
0.000 | 0.000
0.017 | 0.050
0.000 | 0.000
0.000 | 0.000
0.000 | 0.000
0.638 | 0.668
0.299 | 0.320
0.000 | 0.000
3peptides
spectra
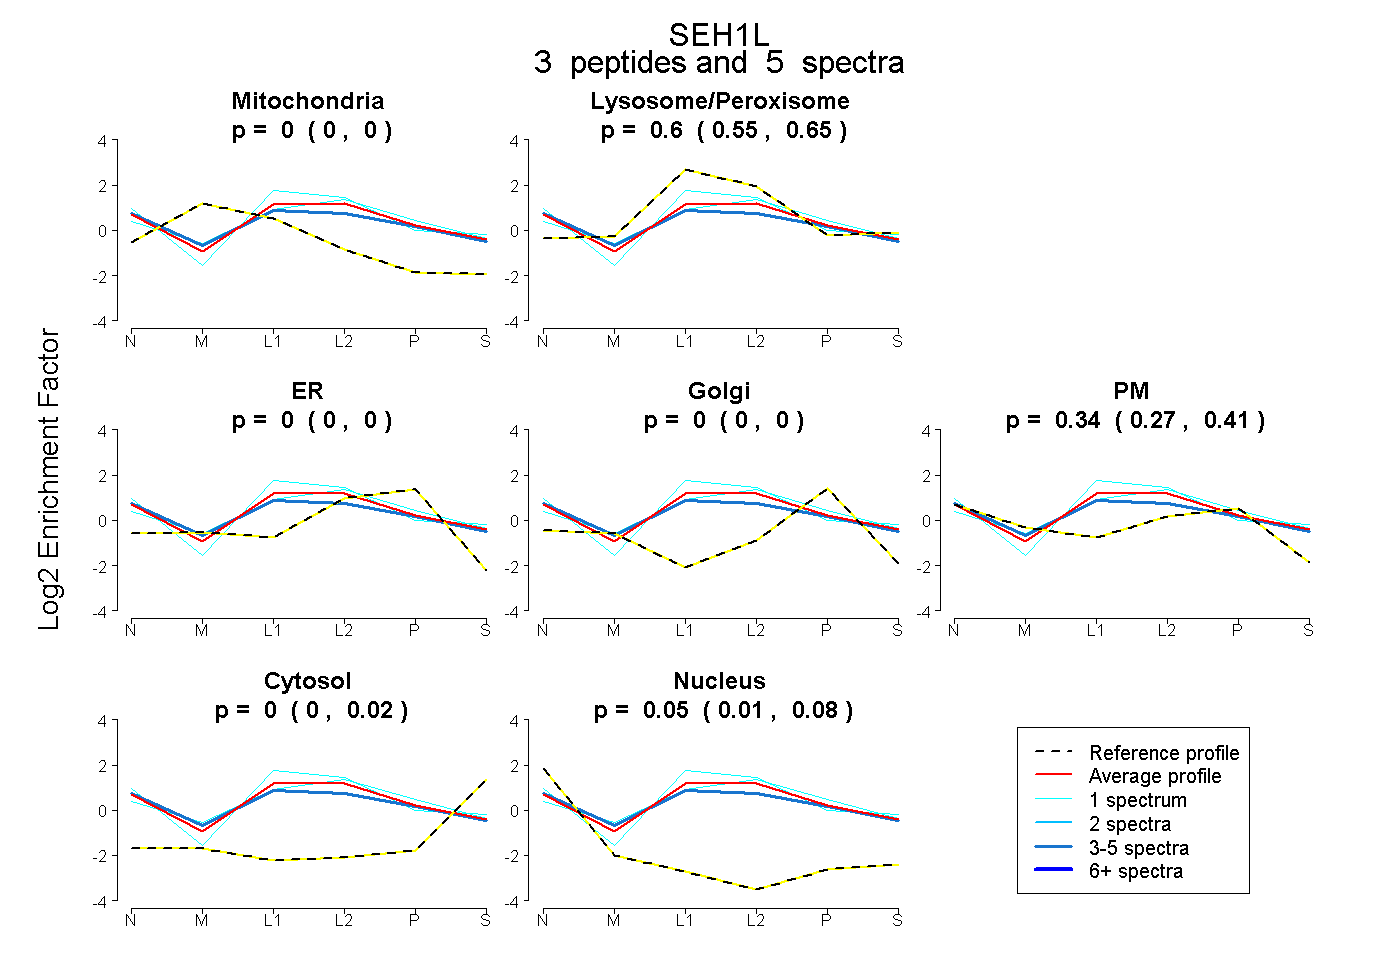
0.000 | 0.000
0.545 | 0.648
0.000 | 0.000
0.000 | 0.000
0.274 | 0.405
0.000 | 0.023
0.011 | 0.079
14peptides
spectra
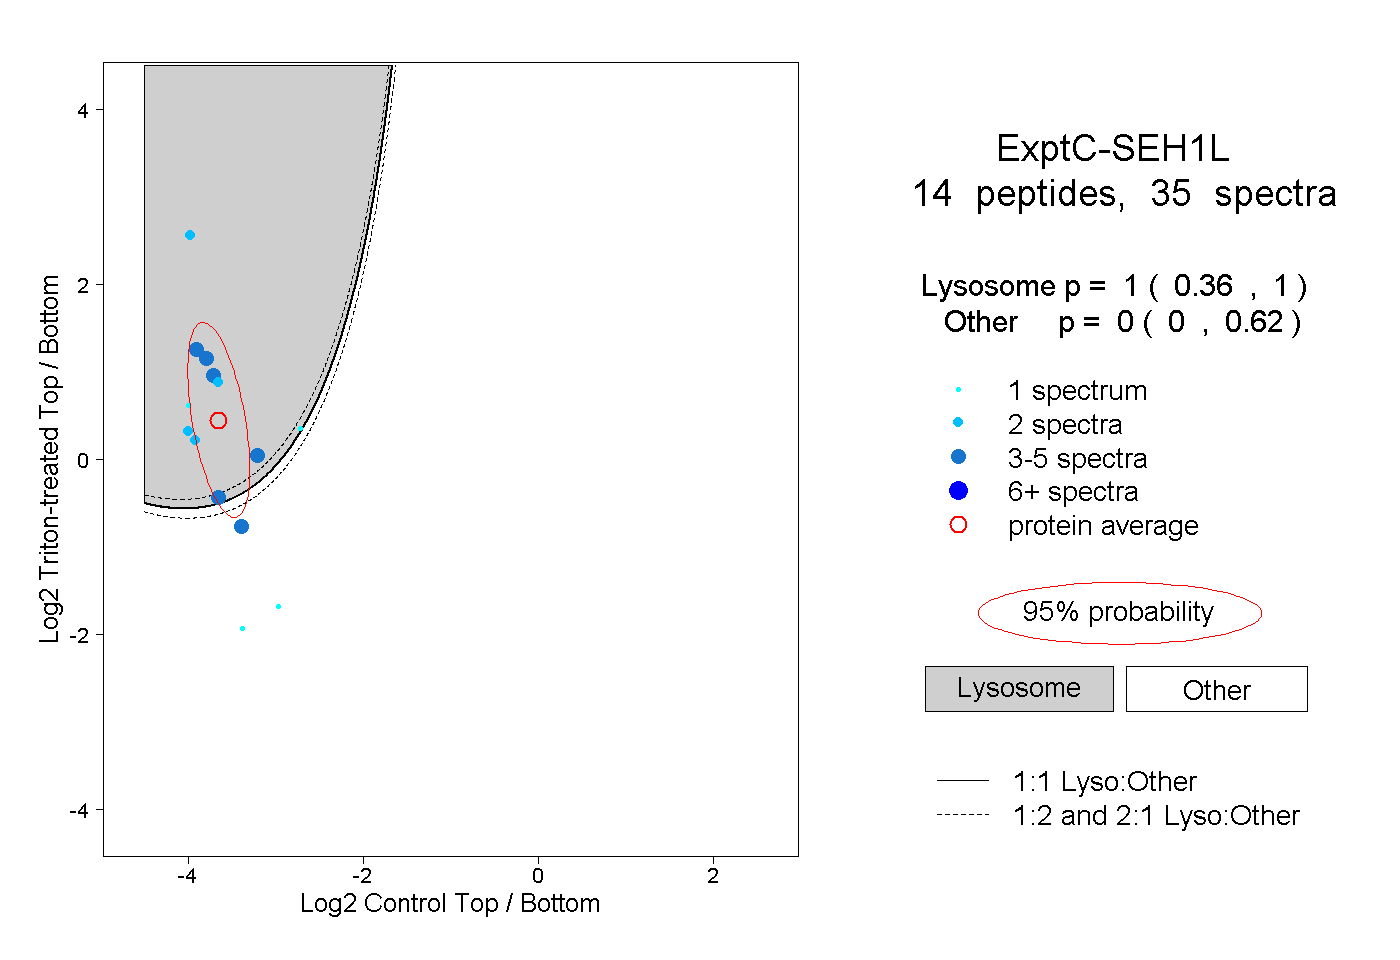
0.360 | 1.000
0.000 | 0.620