 9
9peptides
spectra
0.000 | 0.000
0.017 | 0.050
0.000 | 0.000
0.000 | 0.000
0.000 | 0.000
0.638 | 0.668
0.299 | 0.320
0.000 | 0.000
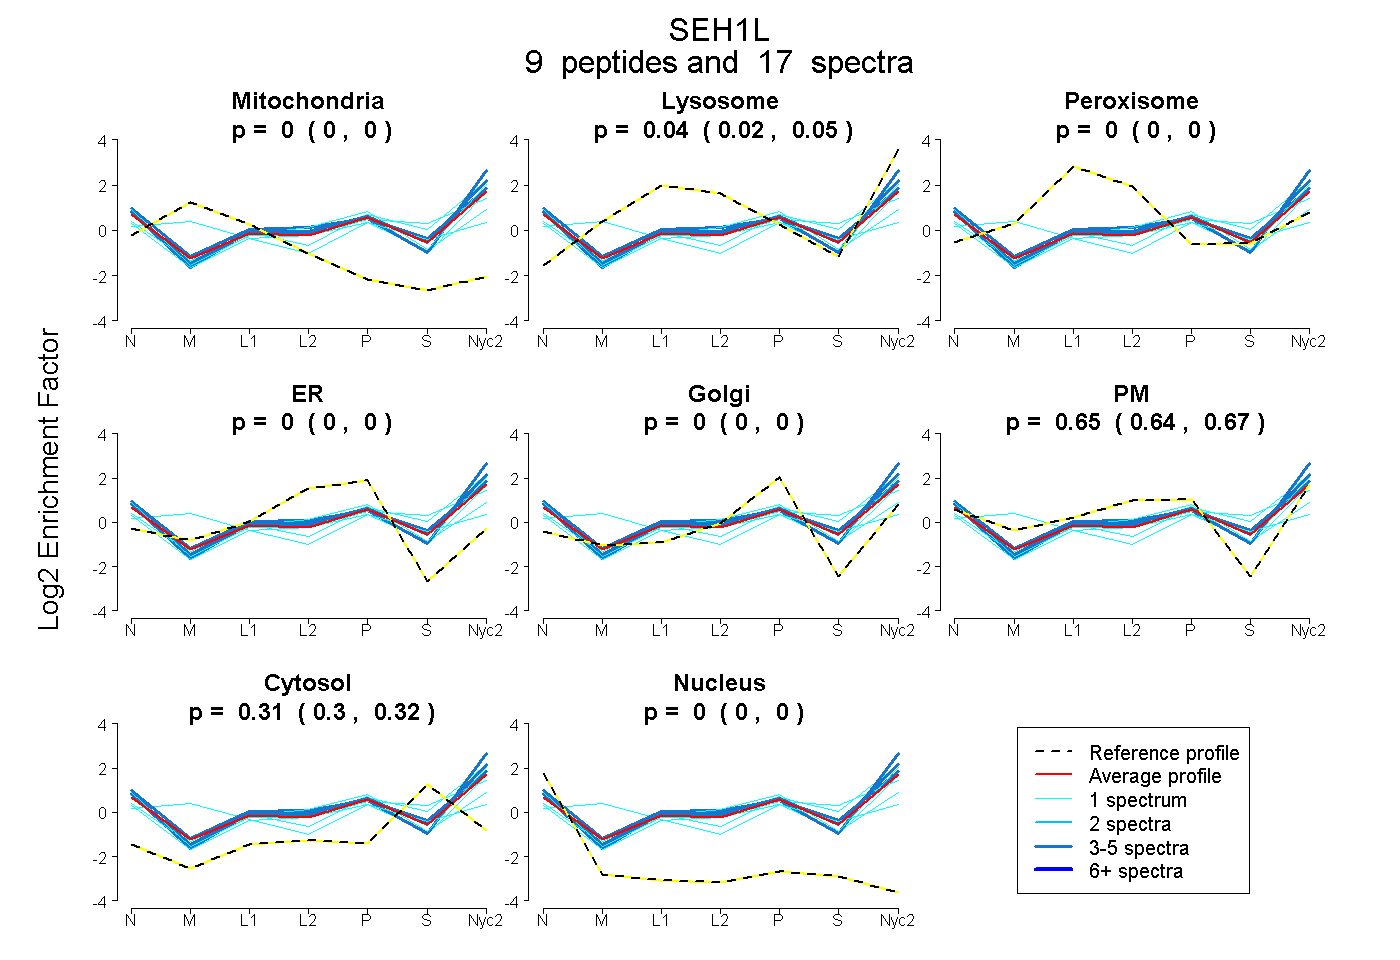
| Plot | Mito | Lyso | Perox | ER | Golgi | PM | Cytosol | Nucleus | |||||
| Expt A |
9 peptides |
17 spectra |
|
0.000 0.000 | 0.000 |
0.035 0.017 | 0.050 |
0.000 0.000 | 0.000 |
0.000 0.000 | 0.000 |
0.000 0.000 | 0.000 |
0.654 0.638 | 0.668 |
0.311 0.299 | 0.320 |
0.000 0.000 | 0.000 |
| 1 spectrum, AHPPMIAVGSDDSSPNSMAK | 0.000 | 0.162 | 0.000 | 0.000 | 0.000 | 0.471 | 0.367 | 0.000 | ||
| 1 spectrum, TTLVDSR | 0.000 | 0.021 | 0.000 | 0.000 | 0.000 | 0.753 | 0.226 | 0.000 | ||
| 1 spectrum, VTWAHPEFGQVLASCSFDR | 0.000 | 0.000 | 0.019 | 0.000 | 0.000 | 0.558 | 0.364 | 0.059 | ||
| 1 spectrum, DLIHDVSFDFHGR | 0.000 | 0.000 | 0.000 | 0.000 | 0.000 | 0.747 | 0.253 | 0.000 | ||
| 1 spectrum, TSVTDVK | 0.000 | 0.083 | 0.000 | 0.000 | 0.000 | 0.465 | 0.453 | 0.000 | ||
| 1 spectrum, ELTSSGGPTK | 0.203 | 0.104 | 0.000 | 0.000 | 0.184 | 0.303 | 0.206 | 0.000 | ||
| 4 spectra, IFTLKPVR | 0.000 | 0.121 | 0.000 | 0.000 | 0.000 | 0.701 | 0.178 | 0.000 | ||
| 4 spectra, VQIFEYNENTR | 0.000 | 0.077 | 0.000 | 0.000 | 0.000 | 0.653 | 0.270 | 0.000 | ||
| 3 spectra, AETLMTVTDPVHDIAFAPNLGR | 0.000 | 0.052 | 0.000 | 0.000 | 0.000 | 0.625 | 0.323 | 0.000 |
| Plot | Mito | Lyso or Perox | ER | Golgi | PM | Cytosol | Nucleus | ||||||
| Expt B |
3 peptides |
5 spectra |
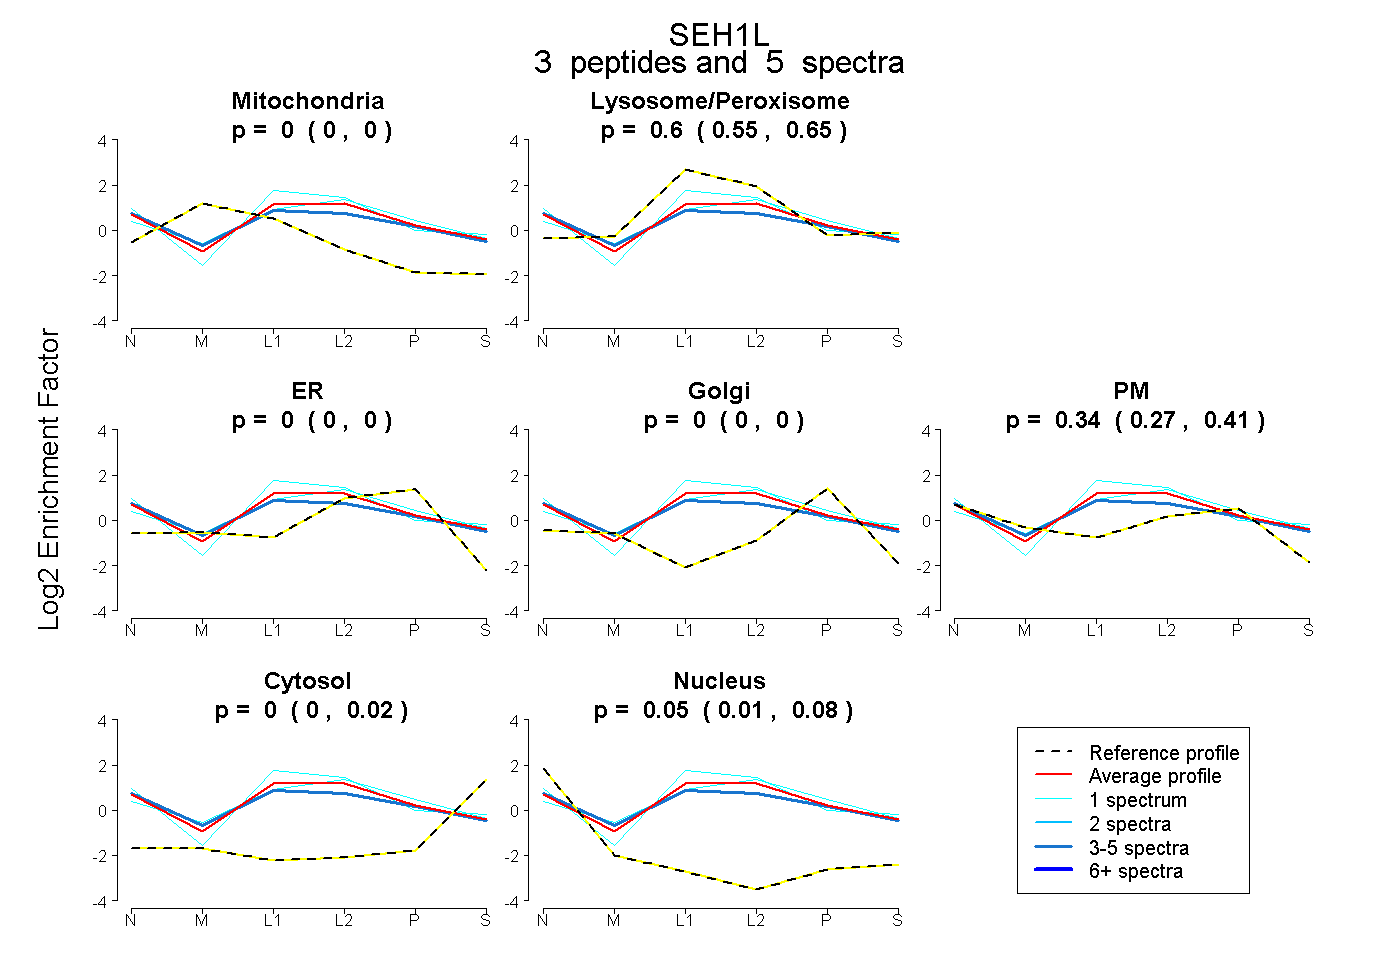 |
0.000 0.000 | 0.000 |
0.604 0.545 | 0.648 |
0.000 0.000 | 0.000 |
0.000 0.000 | 0.000 |
0.345 0.274 | 0.405 |
0.000 0.000 | 0.023 |
0.051 0.011 | 0.079 |
|||
| Plot | Lyso | Other | |||||||||||
| Expt C |
14 peptides |
35 spectra |
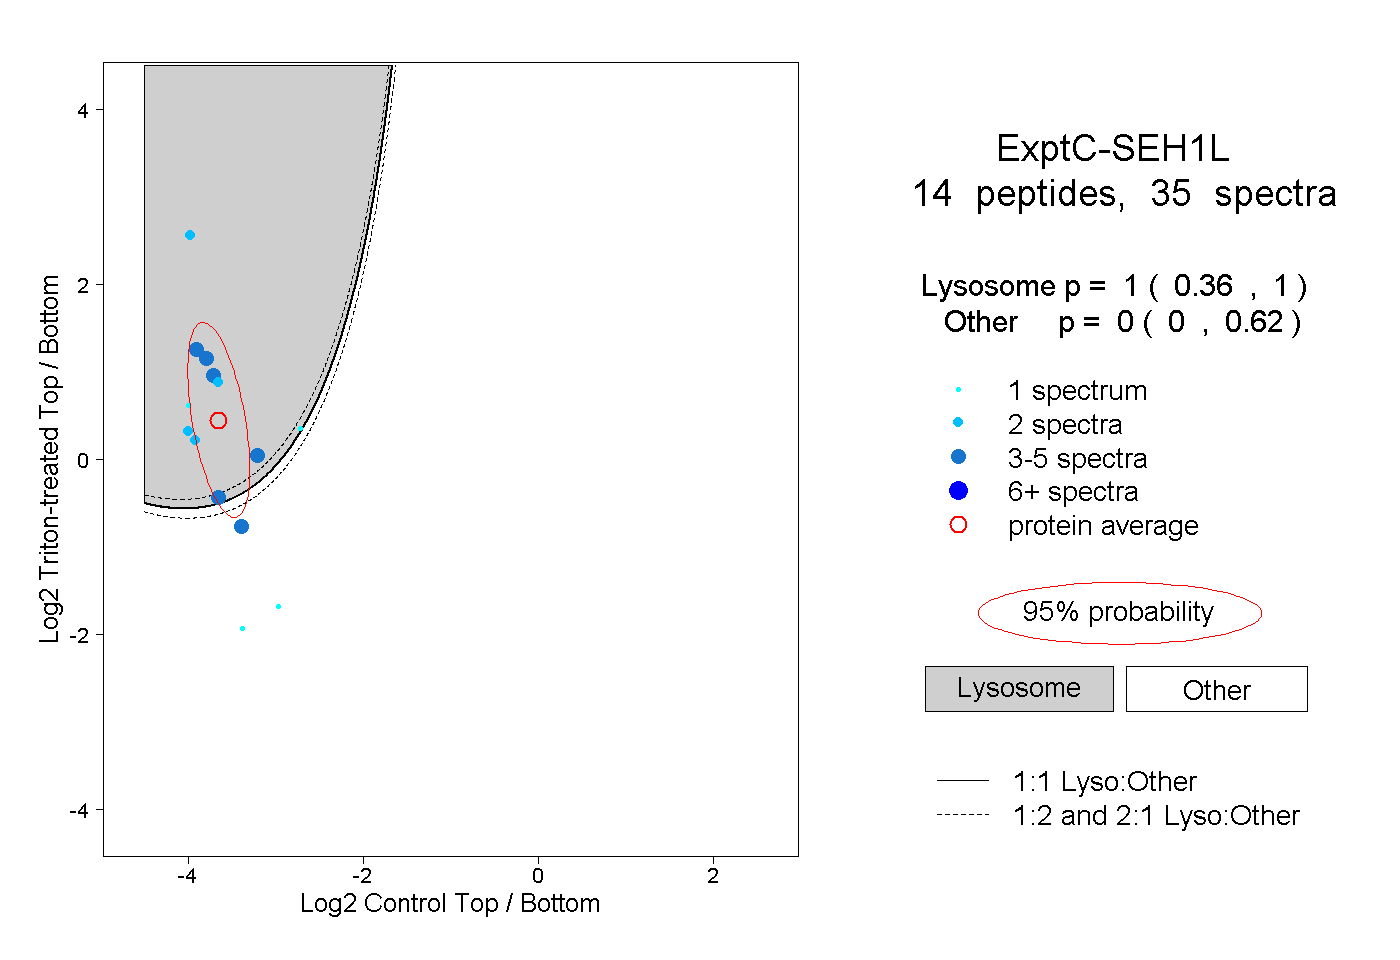 |
1.000 0.360 | 1.000 |
0.000 0.000 | 0.620 |