 16
16peptides
spectra
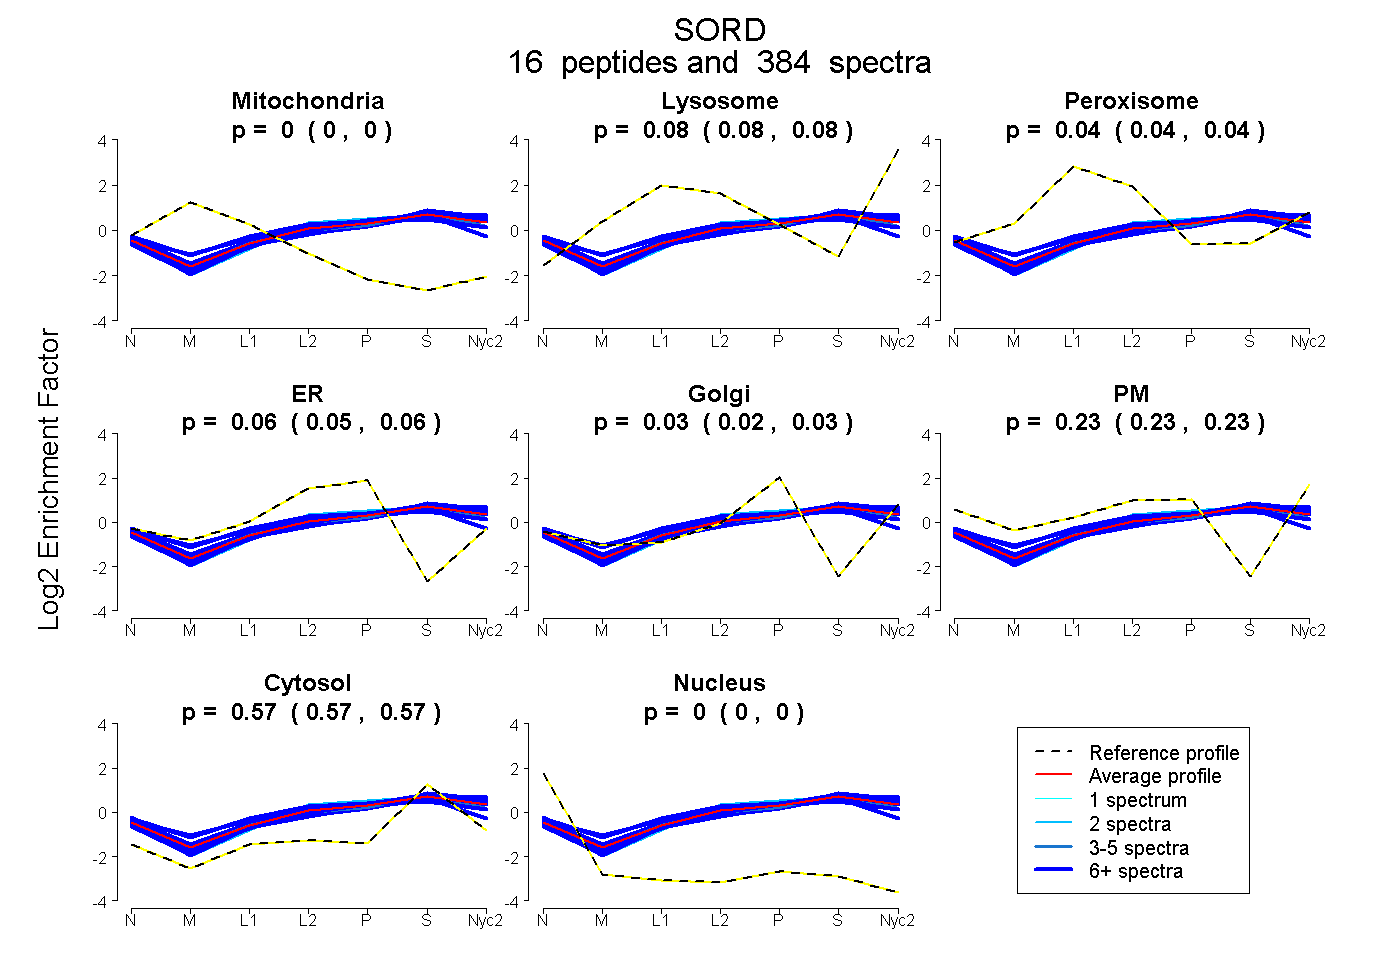
0.000 | 0.000
0.078 | 0.082
0.037 | 0.043
0.052 | 0.058
0.021 | 0.029
0.226 | 0.231
0.568 | 0.570
0.000 | 0.000
14peptides
spectra
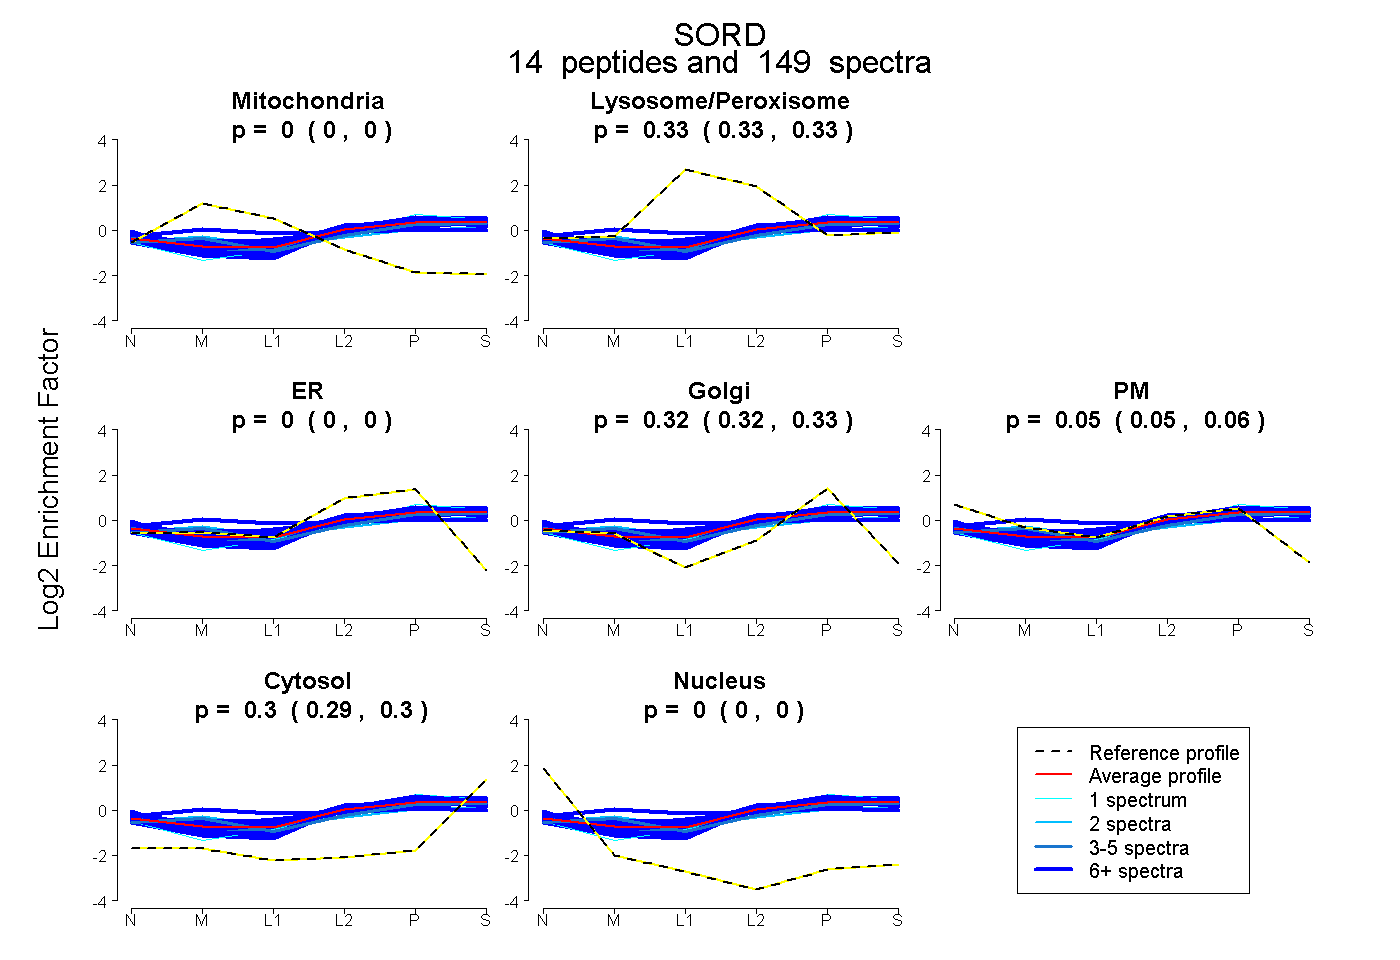
0.000 | 0.000
0.328 | 0.333
0.000 | 0.000
0.316 | 0.325
0.046 | 0.057
0.294 | 0.298
0.000 | 0.000
19peptides
spectra
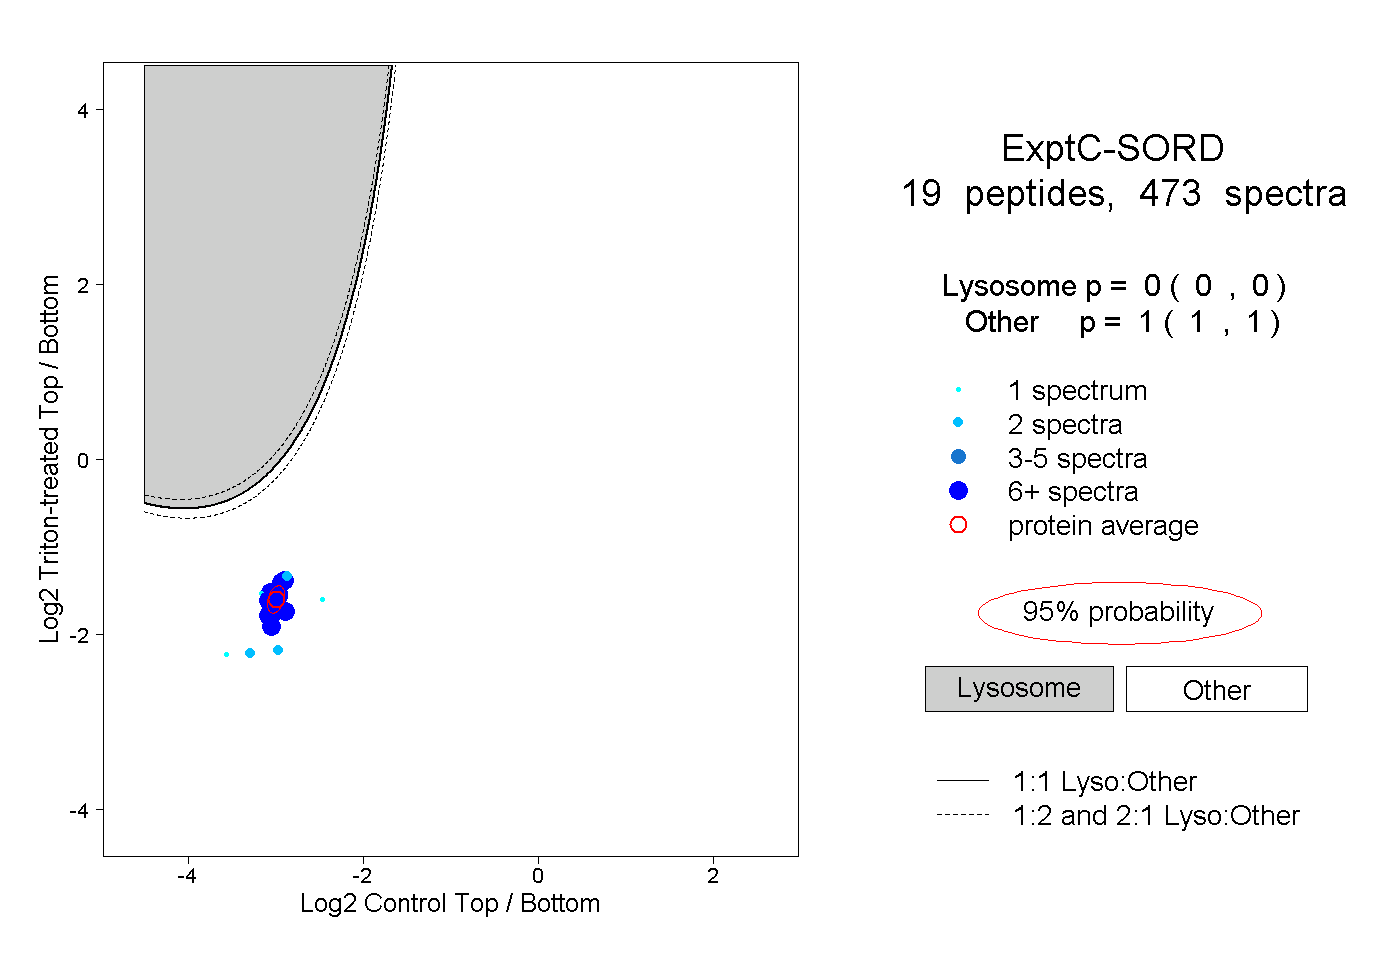
0.000 | 0.000
1.000 | 1.000
11peptides
spectra
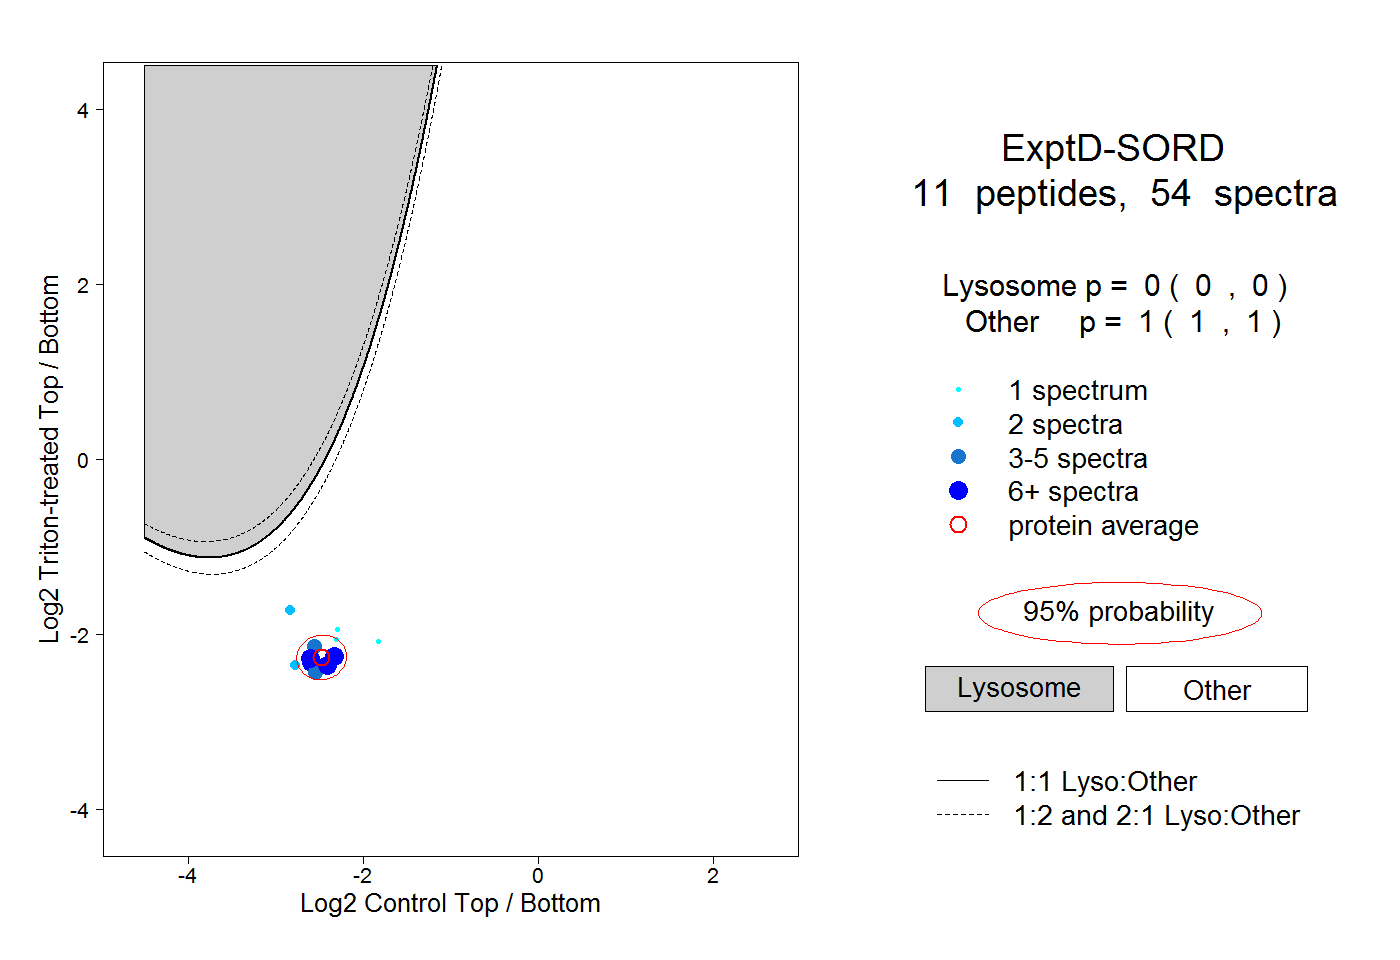
0.000 | 0.000
1.000 | 1.000