 16
16peptides
spectra
0.000 | 0.000
0.078 | 0.082
0.037 | 0.043
0.052 | 0.058
0.021 | 0.029
0.226 | 0.231
0.568 | 0.570
0.000 | 0.000
| Plot | Mito | Lyso | Perox | ER | Golgi | PM | Cytosol | Nucleus | |||||
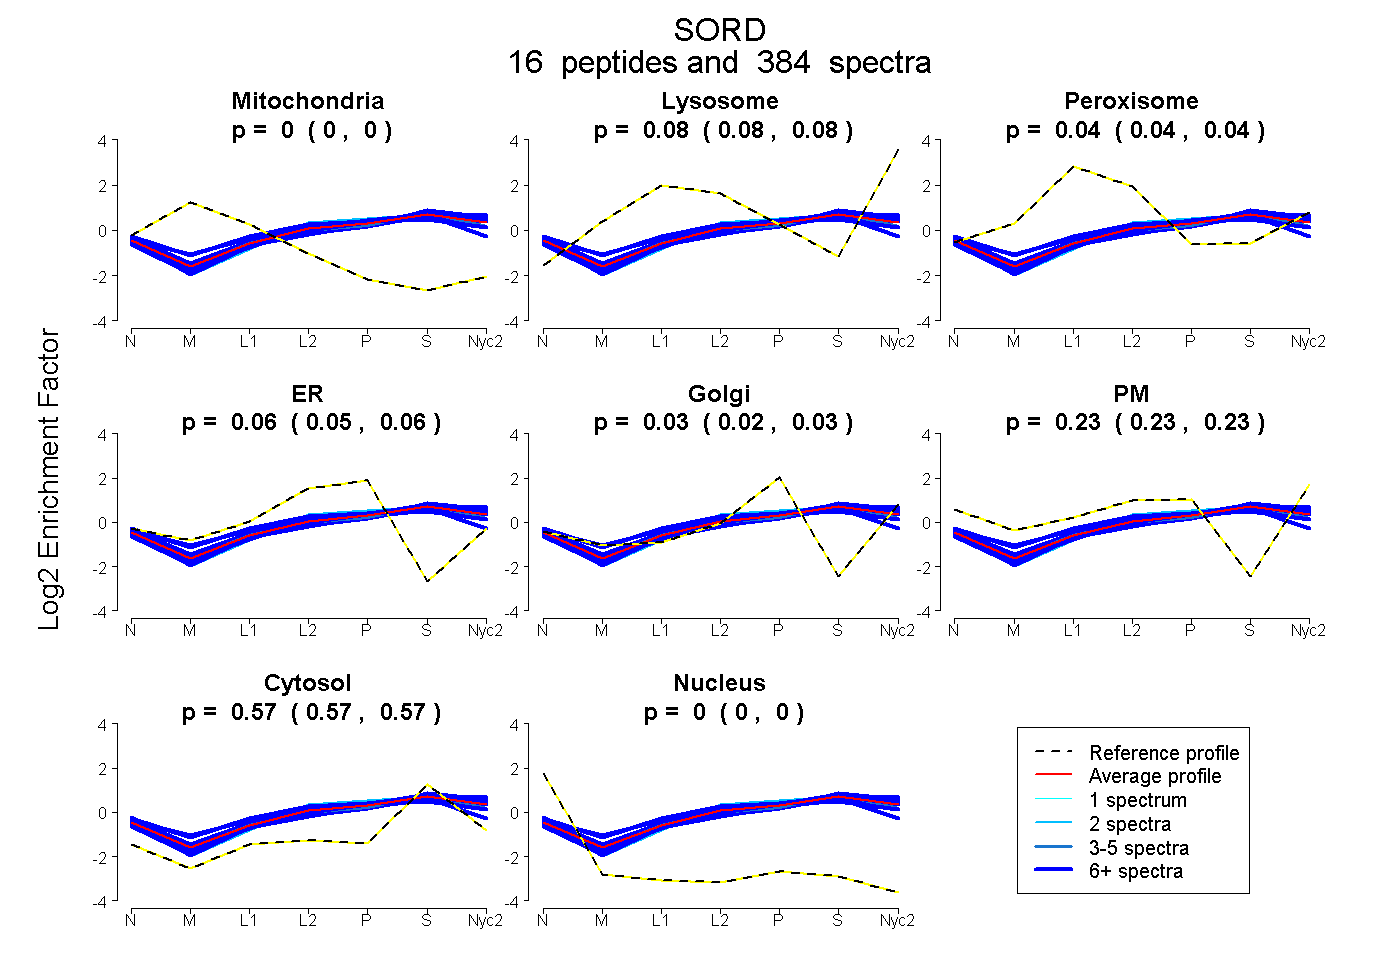
| Expt A |
16 peptides |
384 spectra |
|
0.000 0.000 | 0.000 |
0.080 0.078 | 0.082 |
0.041 0.037 | 0.043 |
0.055 0.052 | 0.058 |
0.026 0.021 | 0.029 |
0.229 0.226 | 0.231 |
0.569 0.568 | 0.570 |
0.000 0.000 | 0.000 |
| 2 spectra, CDPNDQNP | 0.000 | 0.002 | 0.034 | 0.339 | 0.000 | 0.031 | 0.594 | 0.000 | ||
| 18 spectra, AMGASQVVVIDLSASR | 0.000 | 0.149 | 0.000 | 0.000 | 0.074 | 0.157 | 0.620 | 0.000 | ||
| 7 spectra, KPMVLGHEAAGTVTK | 0.000 | 0.106 | 0.058 | 0.055 | 0.113 | 0.120 | 0.548 | 0.000 | ||
| 24 spectra, VGPMVK | 0.000 | 0.160 | 0.000 | 0.001 | 0.103 | 0.161 | 0.575 | 0.000 | ||
| 29 spectra, TLNVKPLVTHR | 0.000 | 0.118 | 0.000 | 0.101 | 0.000 | 0.205 | 0.576 | 0.000 | ||
| 9 spectra, YCNTWPMAVSMLASK | 0.000 | 0.000 | 0.208 | 0.066 | 0.110 | 0.159 | 0.457 | 0.000 | ||
| 16 spectra, IGDFVVK | 0.000 | 0.123 | 0.000 | 0.000 | 0.000 | 0.305 | 0.572 | 0.000 | ||
| 30 spectra, GENLSLVVHGPGDIR | 0.000 | 0.051 | 0.154 | 0.000 | 0.092 | 0.214 | 0.489 | 0.000 | ||
| 61 spectra, VAIEPGVPR | 0.000 | 0.082 | 0.000 | 0.050 | 0.032 | 0.238 | 0.597 | 0.000 | ||
| 8 spectra, HLKPGDR | 0.000 | 0.030 | 0.024 | 0.015 | 0.000 | 0.348 | 0.583 | 0.000 | ||
| 23 spectra, EVGADFTIQVAK | 0.000 | 0.060 | 0.103 | 0.000 | 0.123 | 0.184 | 0.531 | 0.000 | ||
| 3 spectra, LENYPIPELGPNDVLLK | 0.000 | 0.067 | 0.089 | 0.068 | 0.083 | 0.104 | 0.590 | 0.000 | ||
| 27 spectra, AVEAFETAK | 0.000 | 0.064 | 0.064 | 0.000 | 0.000 | 0.315 | 0.557 | 0.000 | ||
| 87 spectra, ETPHDIAK | 0.000 | 0.094 | 0.040 | 0.046 | 0.050 | 0.203 | 0.566 | 0.000 | ||
| 23 spectra, HSADFCYK | 0.000 | 0.000 | 0.111 | 0.217 | 0.000 | 0.107 | 0.565 | 0.000 | ||
| 17 spectra, GSVSLGNK | 0.000 | 0.115 | 0.000 | 0.000 | 0.062 | 0.236 | 0.587 | 0.000 |
| Plot | Mito | Lyso or Perox | ER | Golgi | PM | Cytosol | Nucleus | ||||||
| Expt B |
14 peptides |
149 spectra |
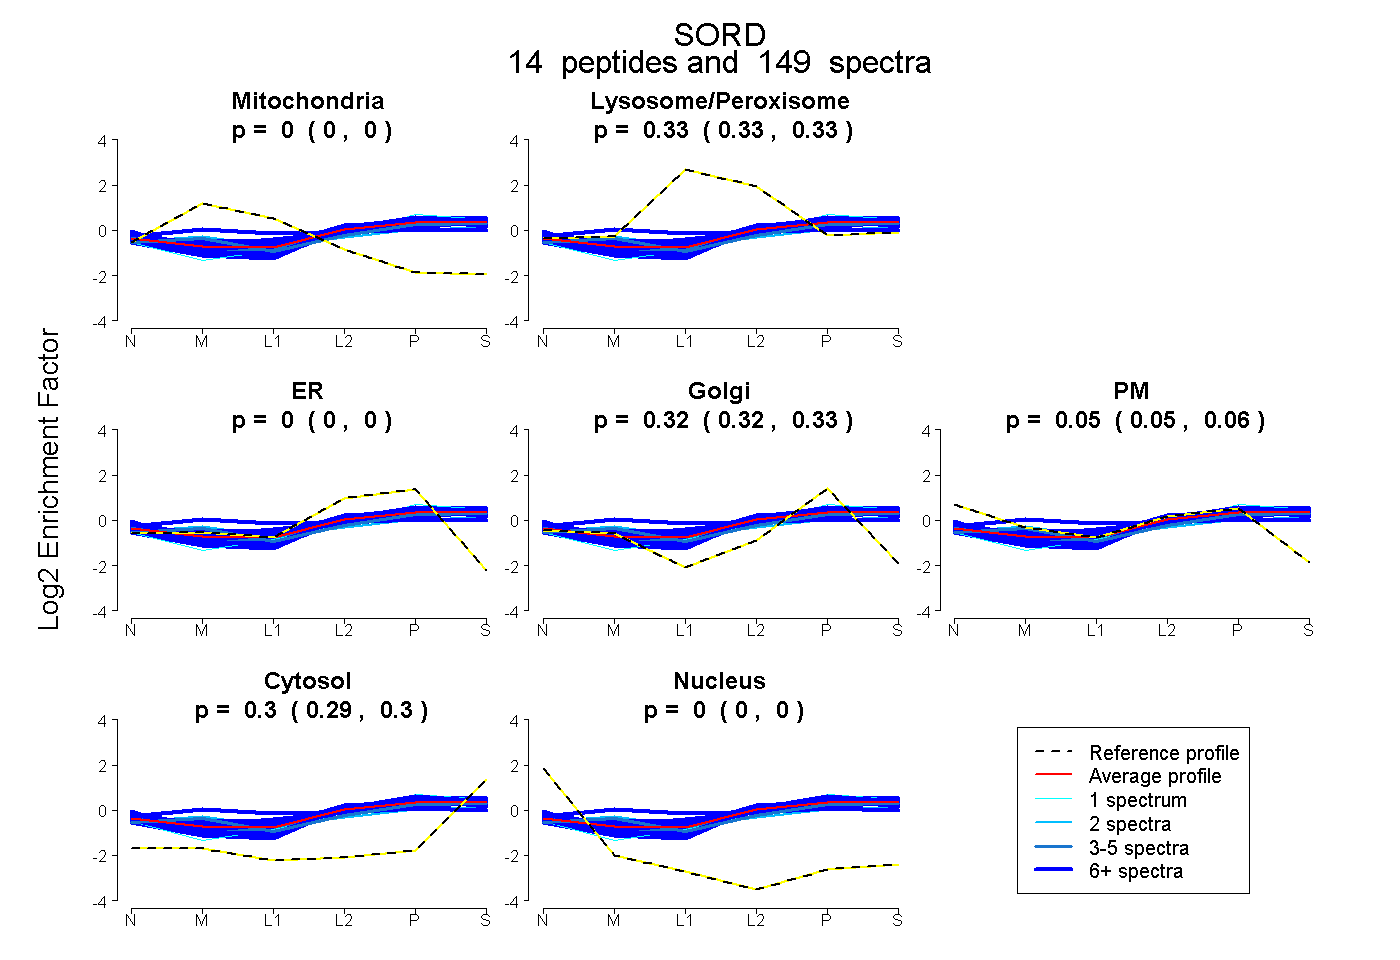 |
0.000 0.000 | 0.000 |
0.331 0.328 | 0.333 |
0.000 0.000 | 0.000 |
0.321 0.316 | 0.325 |
0.052 0.046 | 0.057 |
0.296 0.294 | 0.298 |
0.000 0.000 | 0.000 |
|||
| Plot | Lyso | Other | |||||||||||
| Expt C |
19 peptides |
473 spectra |
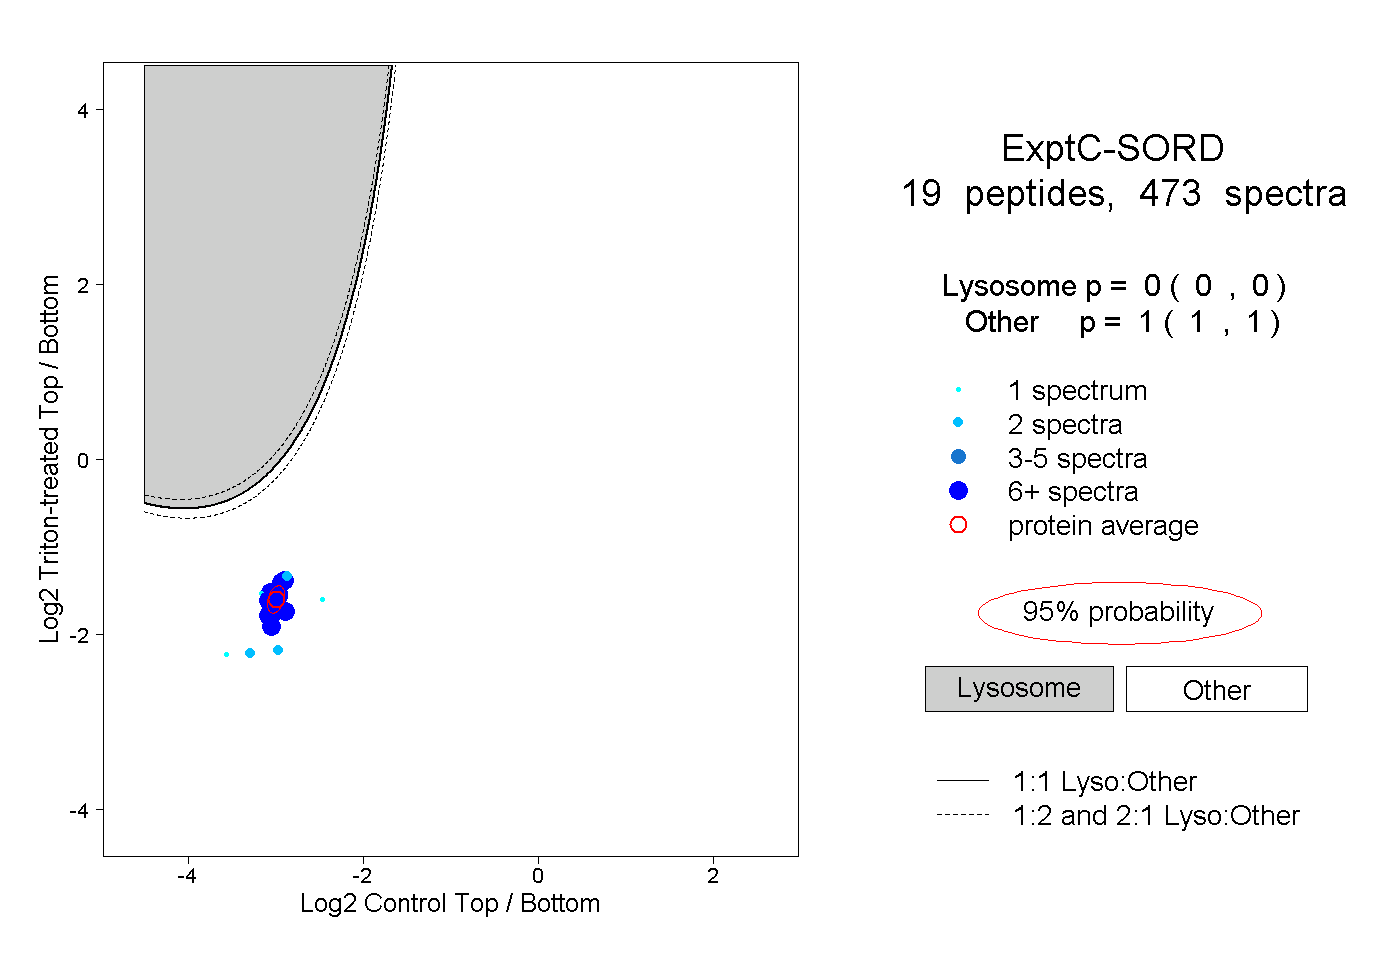 |
0.000 0.000 | 0.000 |
1.000 1.000 | 1.000 |
||||||||
| Plot | Lyso | Other | |||||||||||
| Expt D |
11 peptides |
54 spectra |
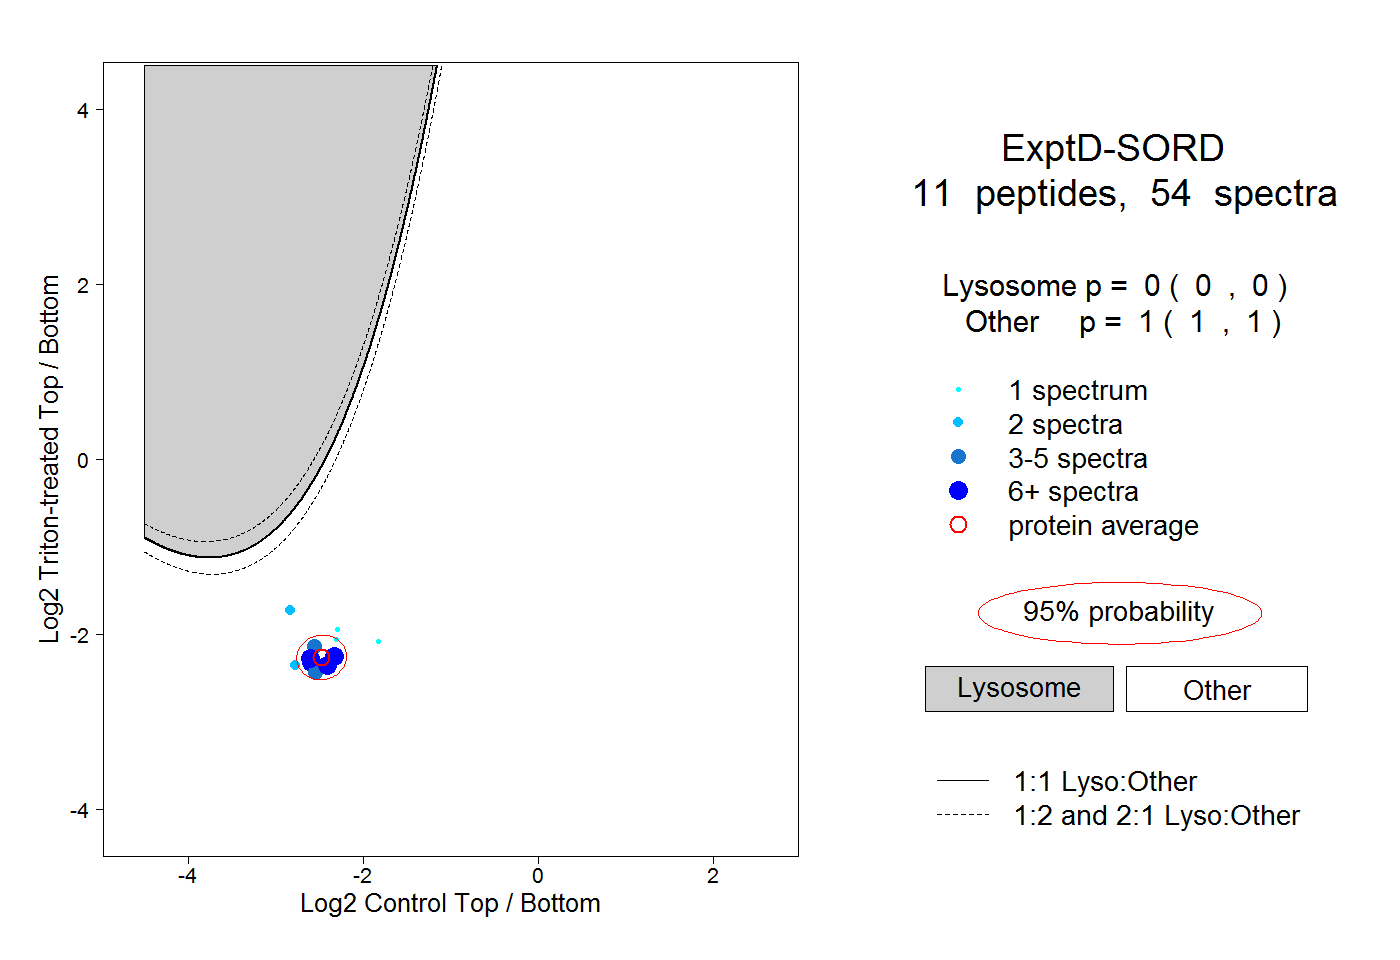 |
0.000 0.000 | 0.000 |
1.000 1.000 | 1.000 |