 3
3peptides
spectra
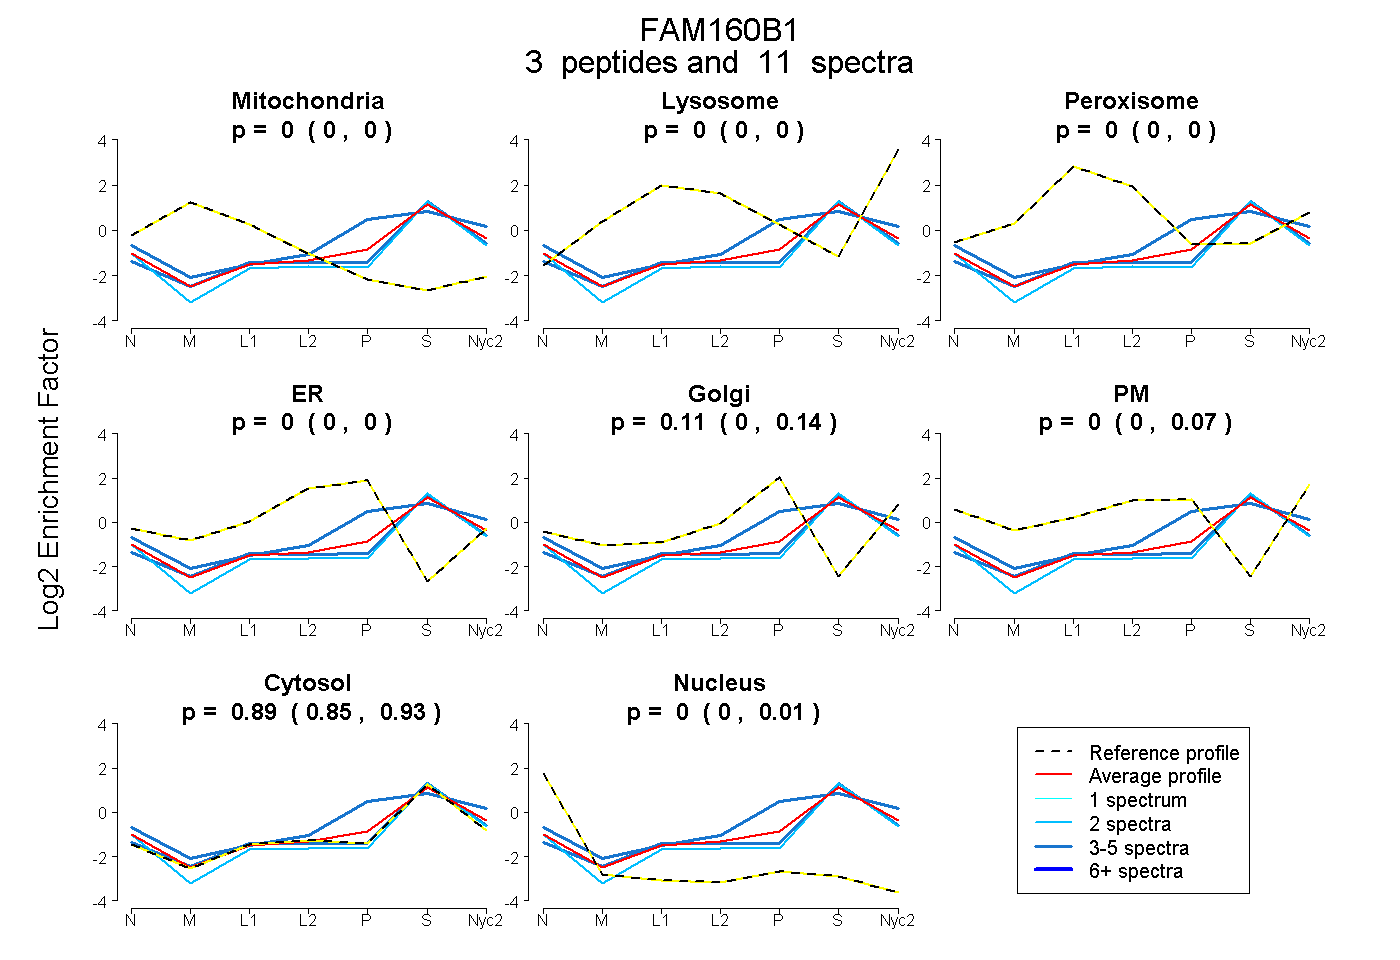
0.000 | 0.000
0.000 | 0.001
0.000 | 0.000
0.000 | 0.000
0.000 | 0.142
0.000 | 0.069
0.850 | 0.929
0.000 | 0.007
3peptides
spectra
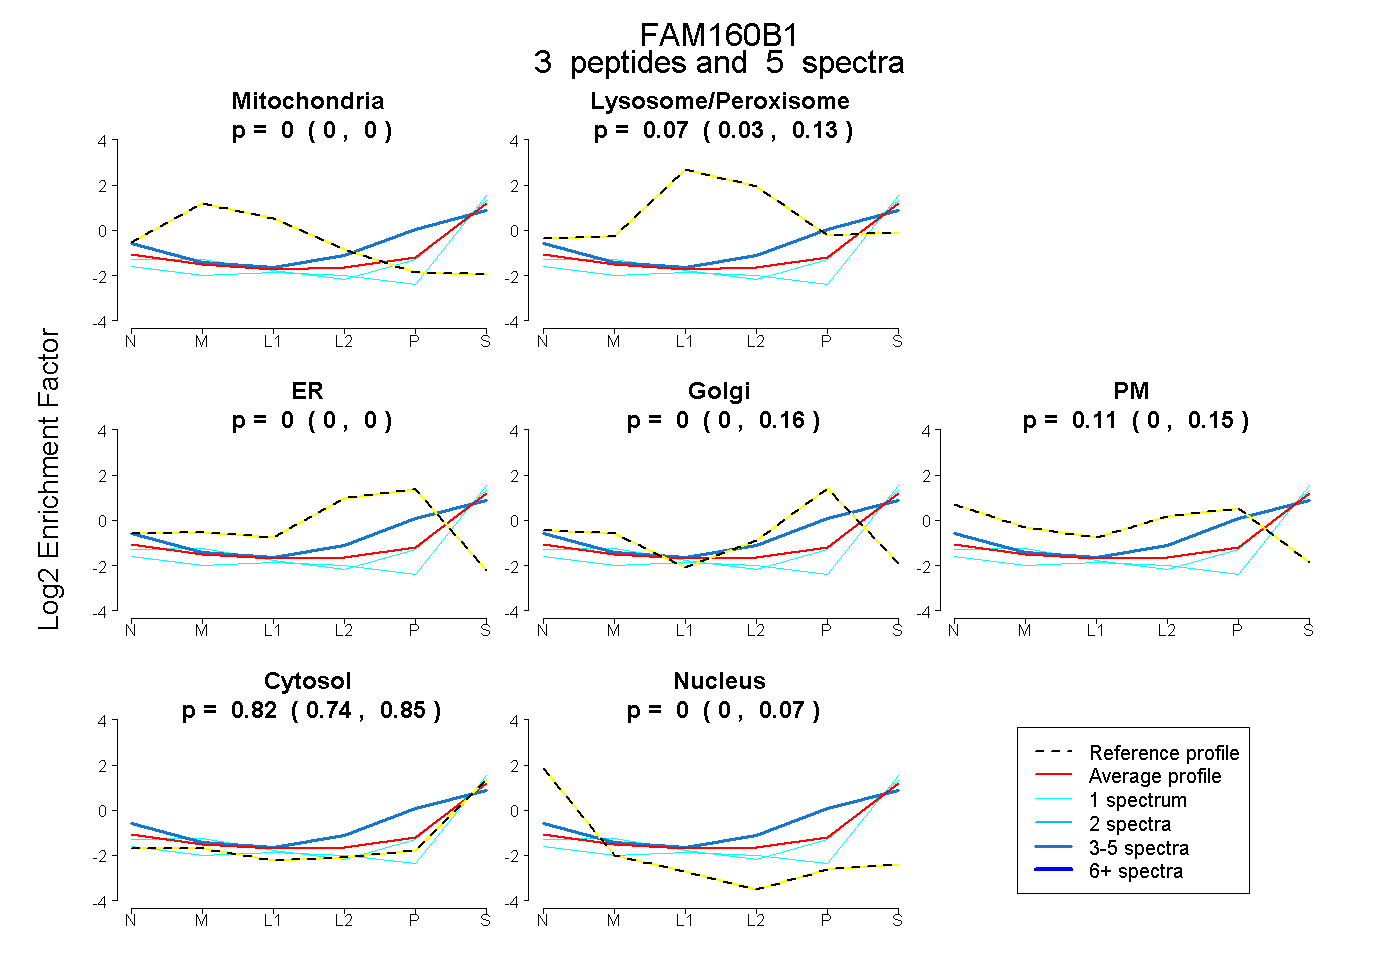
0.000 | 0.000
0.028 | 0.132
0.000 | 0.000
0.000 | 0.155
0.000 | 0.146
0.737 | 0.854
0.000 | 0.073
5peptides
spectra
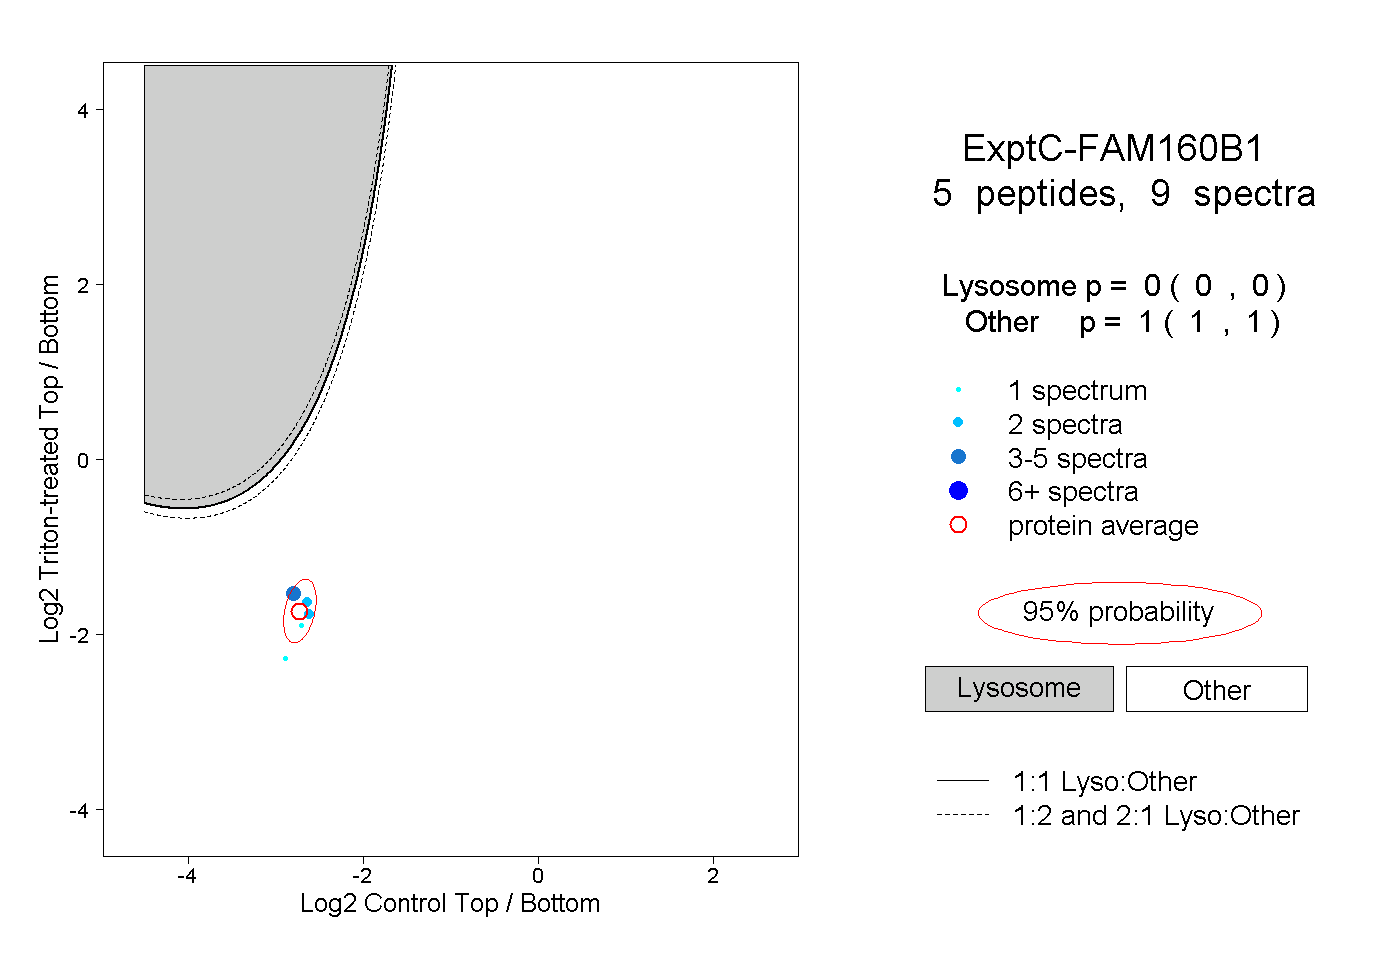
0.000 | 0.000
1.000 | 1.000