FAM160B1
[ENSRNOP00000023247]
Main page
| | | Plot |
Mito |
Lyso |
|
Perox |
ER |
Golgi |
PM |
Cytosol |
Nucleus |
|
| Expt A |
 3
3
peptides |
11
spectra |
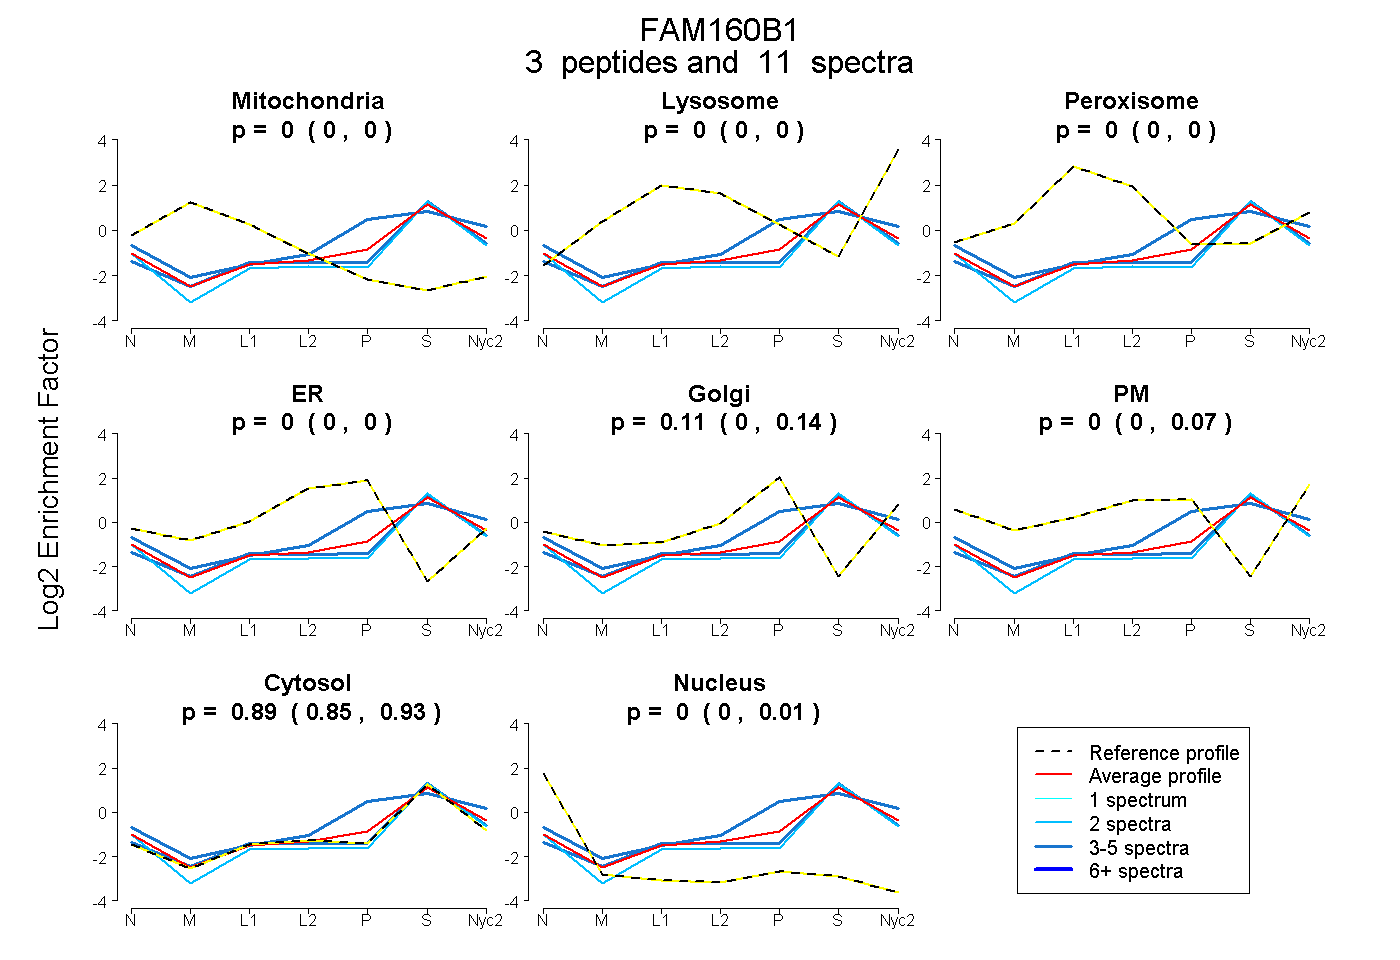 |
0.000
0.000 | 0.000 |
0.000
0.000 | 0.001 |
|
0.000
0.000 | 0.000 |
0.000
0.000 | 0.000 |
0.106
0.000 | 0.142 |
0.000
0.000 | 0.069 |
0.894
0.850 | 0.929 |
0.000
0.000 | 0.007 |
|
| | | Plot |
Mito |
|
Lyso or Perox |
|
ER |
Golgi |
PM |
Cytosol |
Nucleus |
|
| Expt B |
3
peptides |
5
spectra |
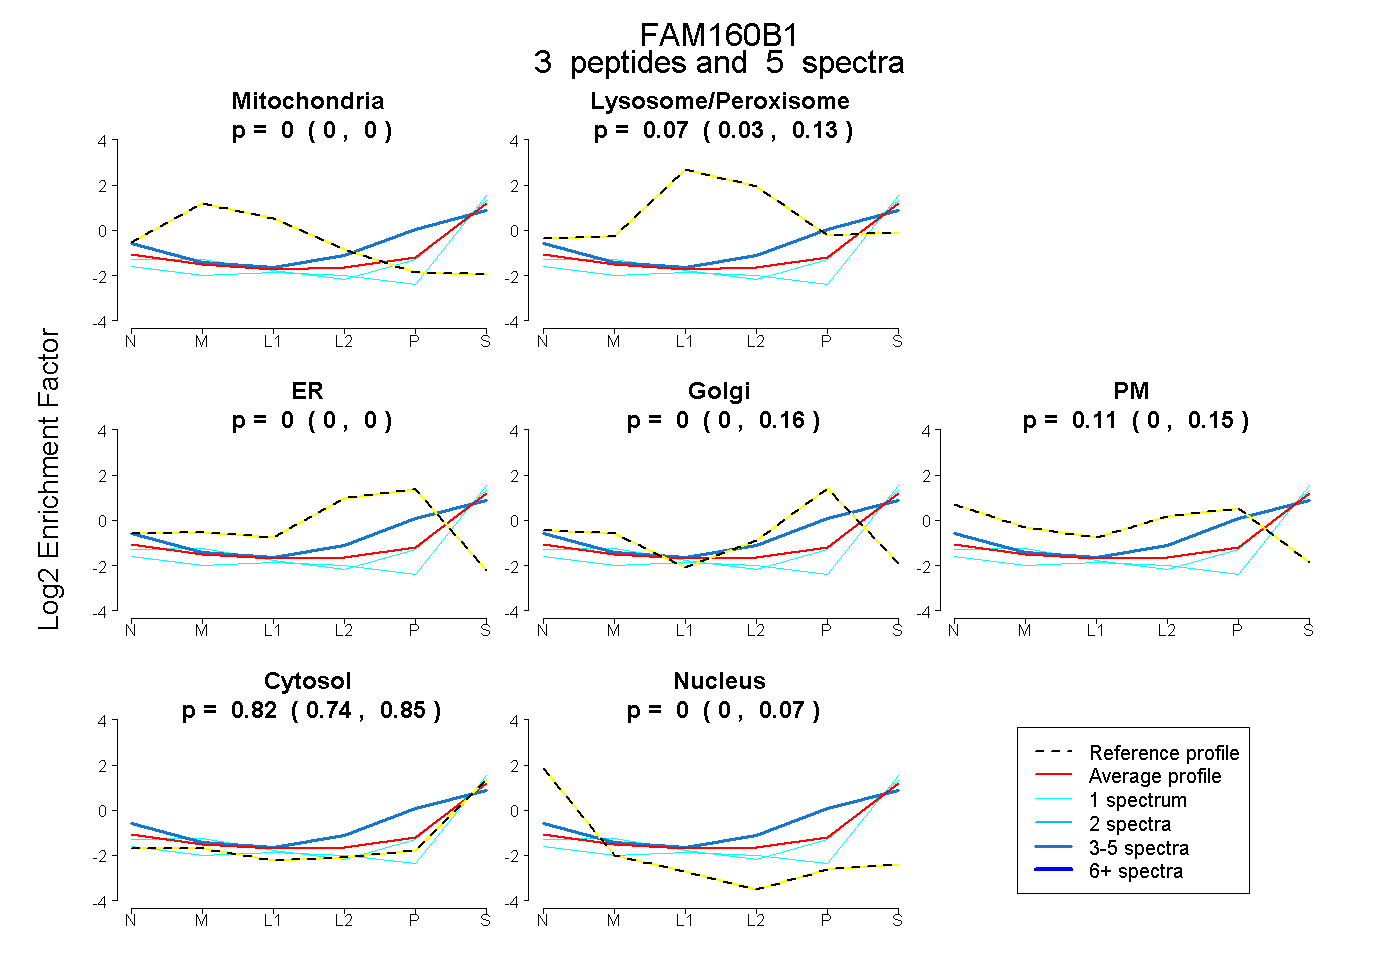 |
0.000
0.000 | 0.000 |
|
0.066
0.028 | 0.132 |
|
0.000
0.000 | 0.000 |
0.000
0.000 | 0.155 |
0.112
0.000 | 0.146 |
0.823
0.737 | 0.854 |
0.000
0.000 | 0.073 |
|
| 1 spectrum, EPETLSEISR |
0.024 |
|
0.043 |
|
0.000 |
0.050 |
0.001 |
0.877 |
0.004 |
|
| 1 spectrum, ILETLYTLGK |
0.000 |
|
0.012 |
|
0.000 |
0.000 |
0.000 |
0.987 |
0.001 |
|
| 3 spectra, LLLVR |
0.000 |
|
0.133 |
|
0.000 |
0.318 |
0.000 |
0.550 |
0.000 |
|
| | | Plot |
|
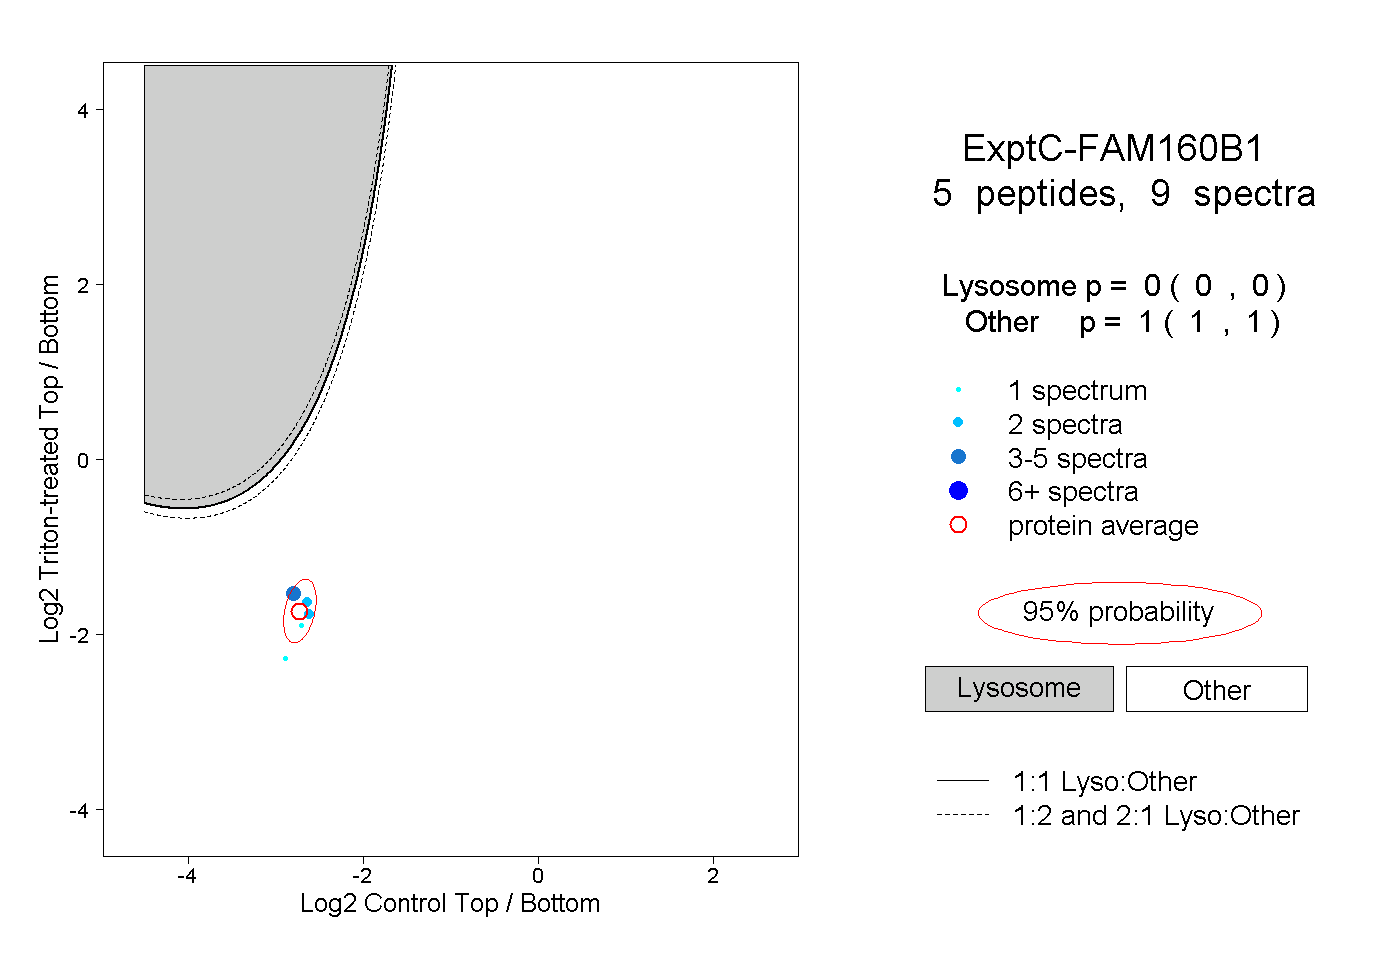
Lyso |
|
|
|
|
|
|
|
Other |
| Expt C |
5
peptides |
9
spectra |
 |
|
0.000
0.000 | 0.000 |
|
|
|
|
|
|
|
1.000
1.000 | 1.000 |