 5
5peptides
spectra
0.000 | 0.000
0.000 | 0.000
0.000 | 0.060
0.000 | 0.000
0.000 | 0.107
0.092 | 0.227
0.722 | 0.781
0.000 | 0.000
1peptide
spectra
NA | NA
NA | NA
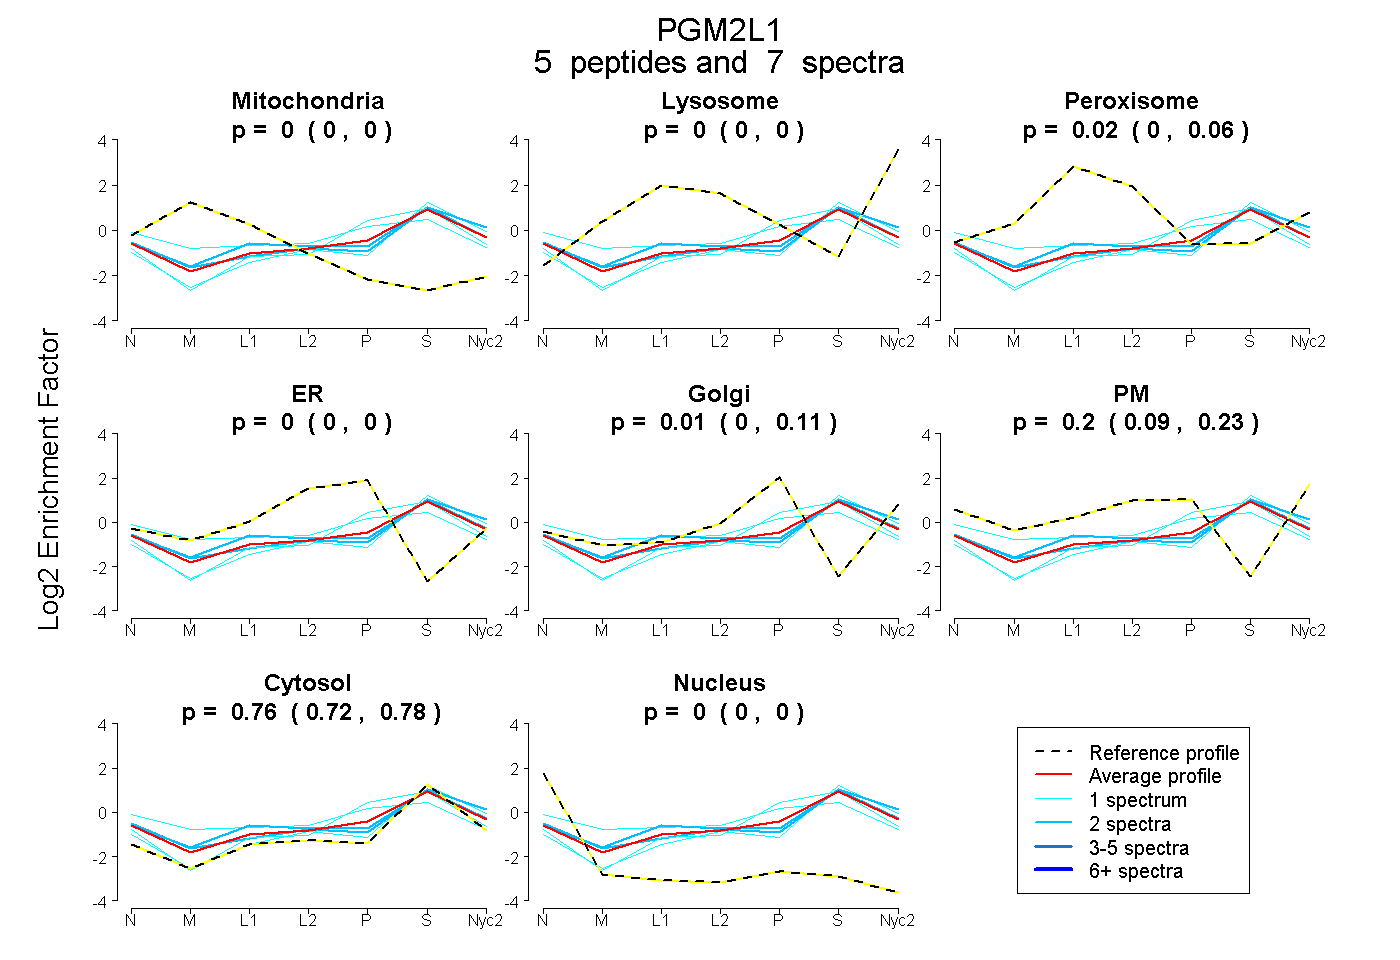
| Plot | Mito | Lyso | Perox | ER | Golgi | PM | Cytosol | Nucleus | |||||
| Expt A |
5 peptides |
7 spectra |
|
0.000 0.000 | 0.000 |
0.000 0.000 | 0.000 |
0.022 0.000 | 0.060 |
0.000 0.000 | 0.000 |
0.012 0.000 | 0.107 |
0.203 0.092 | 0.227 |
0.763 0.722 | 0.781 |
0.000 0.000 | 0.000 |
||
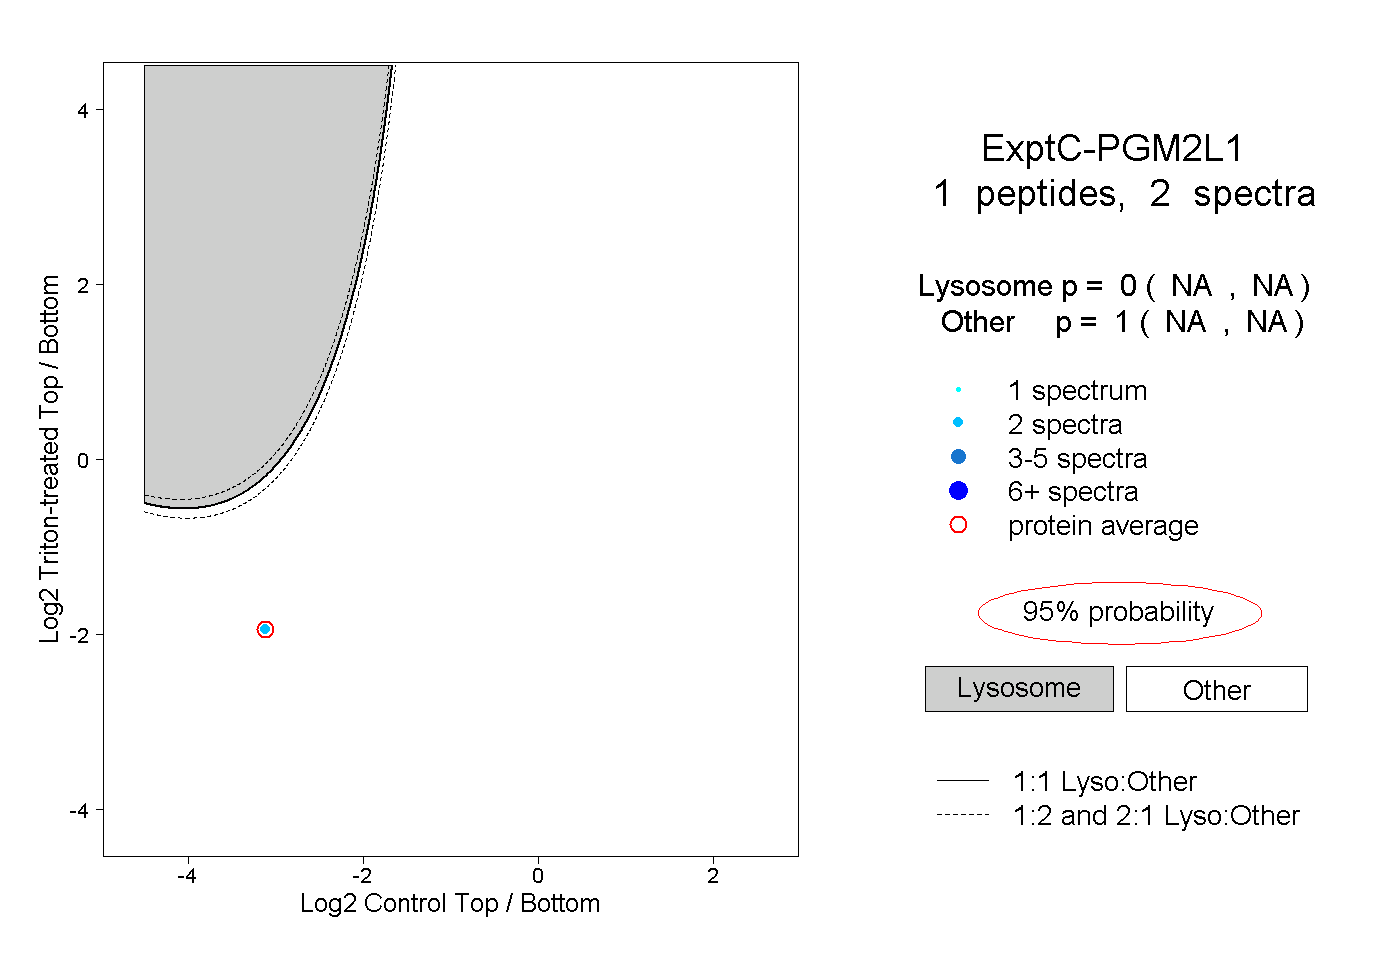
| Plot | Lyso | Other | |||||||||||
| Expt C |
1 peptide |
2 spectra |
|
0.000 NA | NA |
1.000 NA | NA |