 5
5peptides
spectra
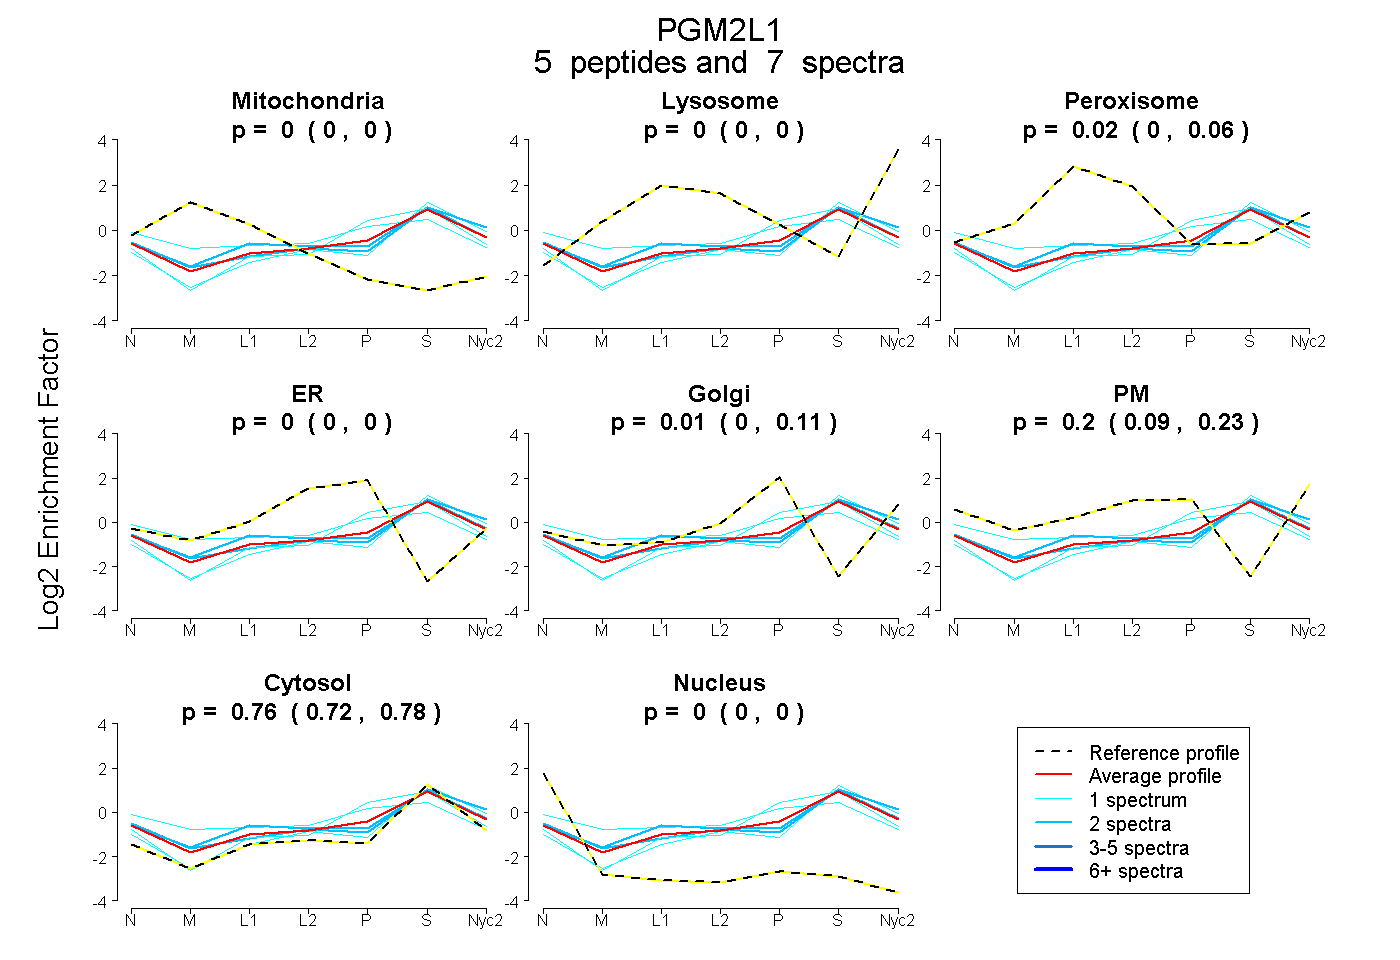
0.000 | 0.000
0.000 | 0.000
0.000 | 0.060
0.000 | 0.000
0.000 | 0.107
0.092 | 0.227
0.722 | 0.781
0.000 | 0.000
| Plot | Mito | Lyso | Perox | ER | Golgi | PM | Cytosol | Nucleus | |||||
| Expt A |
5 peptides |
7 spectra |
|
0.000 0.000 | 0.000 |
0.000 0.000 | 0.000 |
0.022 0.000 | 0.060 |
0.000 0.000 | 0.000 |
0.012 0.000 | 0.107 |
0.203 0.092 | 0.227 |
0.763 0.722 | 0.781 |
0.000 0.000 | 0.000 |
| 1 spectrum, IVLATDPDADR | 0.000 | 0.037 | 0.000 | 0.000 | 0.000 | 0.071 | 0.892 | 0.000 | ||
| 2 spectra, MTFGTAGLR | 0.000 | 0.051 | 0.000 | 0.000 | 0.000 | 0.178 | 0.771 | 0.000 | ||
| 2 spectra, SKPNADVK | 0.000 | 0.000 | 0.147 | 0.000 | 0.000 | 0.119 | 0.734 | 0.000 | ||
| 1 spectrum, TSGTEPK | 0.000 | 0.000 | 0.000 | 0.000 | 0.261 | 0.000 | 0.739 | 0.000 | ||
| 1 spectrum, AVAGVMITASHNR | 0.091 | 0.000 | 0.107 | 0.092 | 0.183 | 0.007 | 0.520 | 0.000 |
| Plot | Lyso | Other | |||||||||||
| Expt C |
1 peptide |
2 spectra |
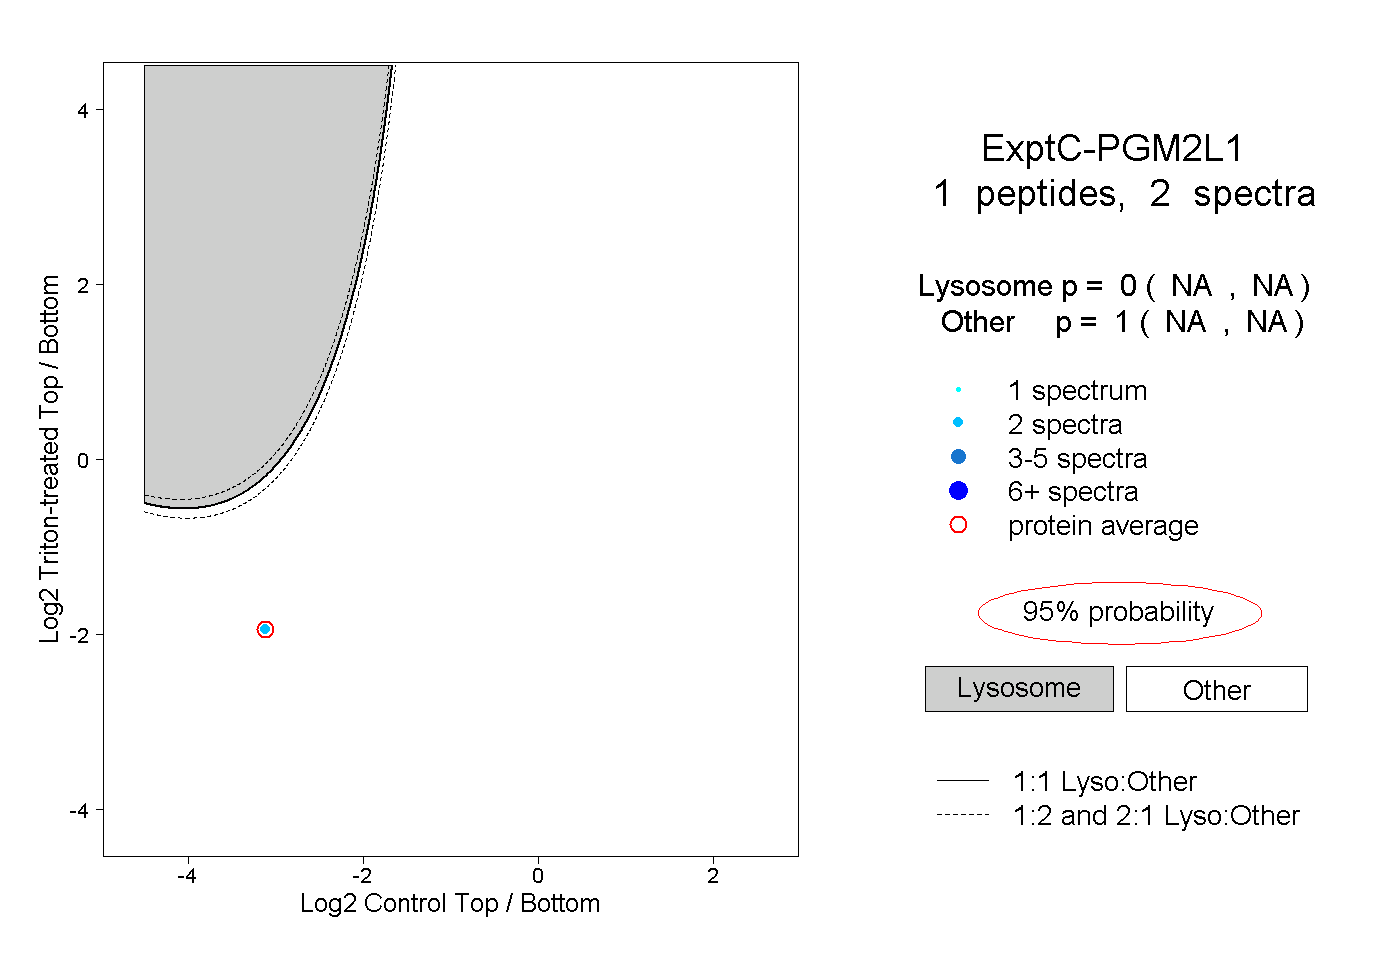 |
0.000 NA | NA |
1.000 NA | NA |