 3
3peptides
spectra
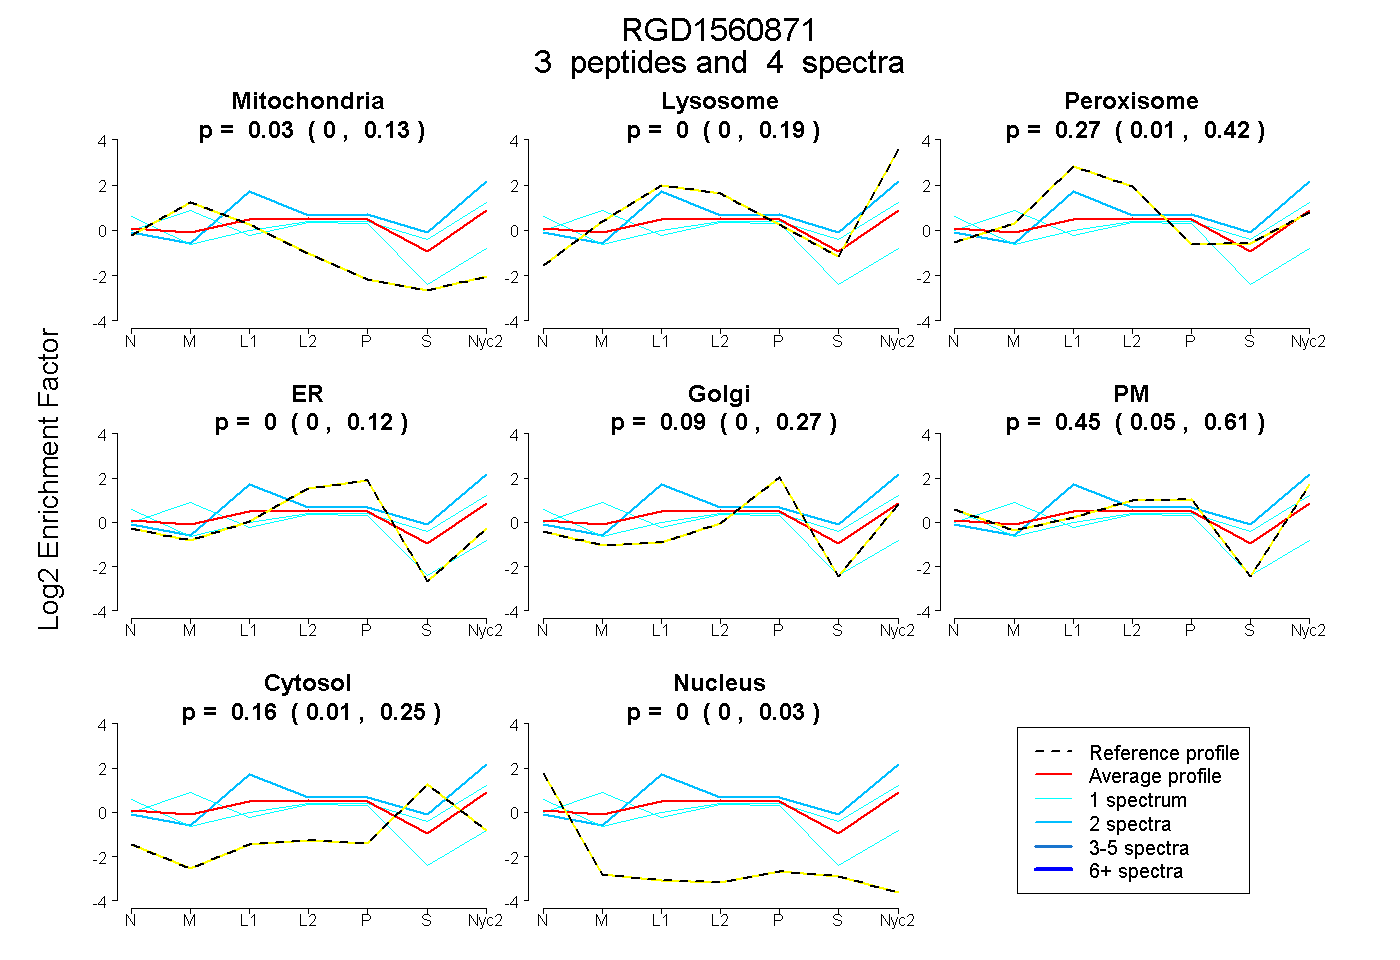
0.000 | 0.133
0.000 | 0.193
0.007 | 0.416
0.000 | 0.116
0.000 | 0.273
0.055 | 0.606
0.010 | 0.249
0.000 | 0.030
2peptides
spectra
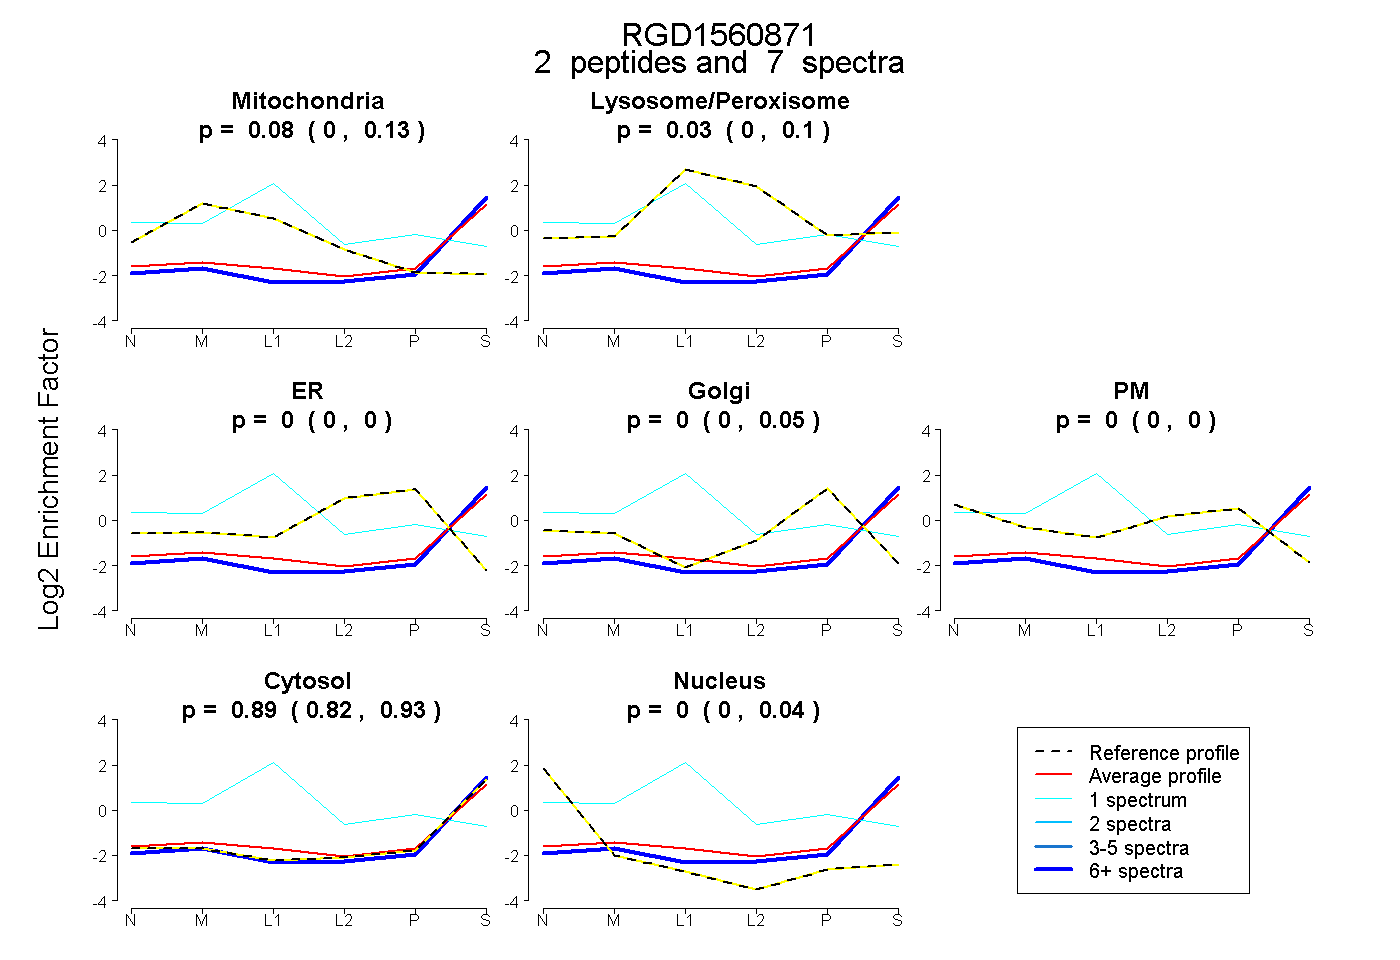
0.000 | 0.125
0.000 | 0.096
0.000 | 0.000
0.000 | 0.048
0.000 | 0.000
0.817 | 0.932
0.000 | 0.038
2peptides
spectra
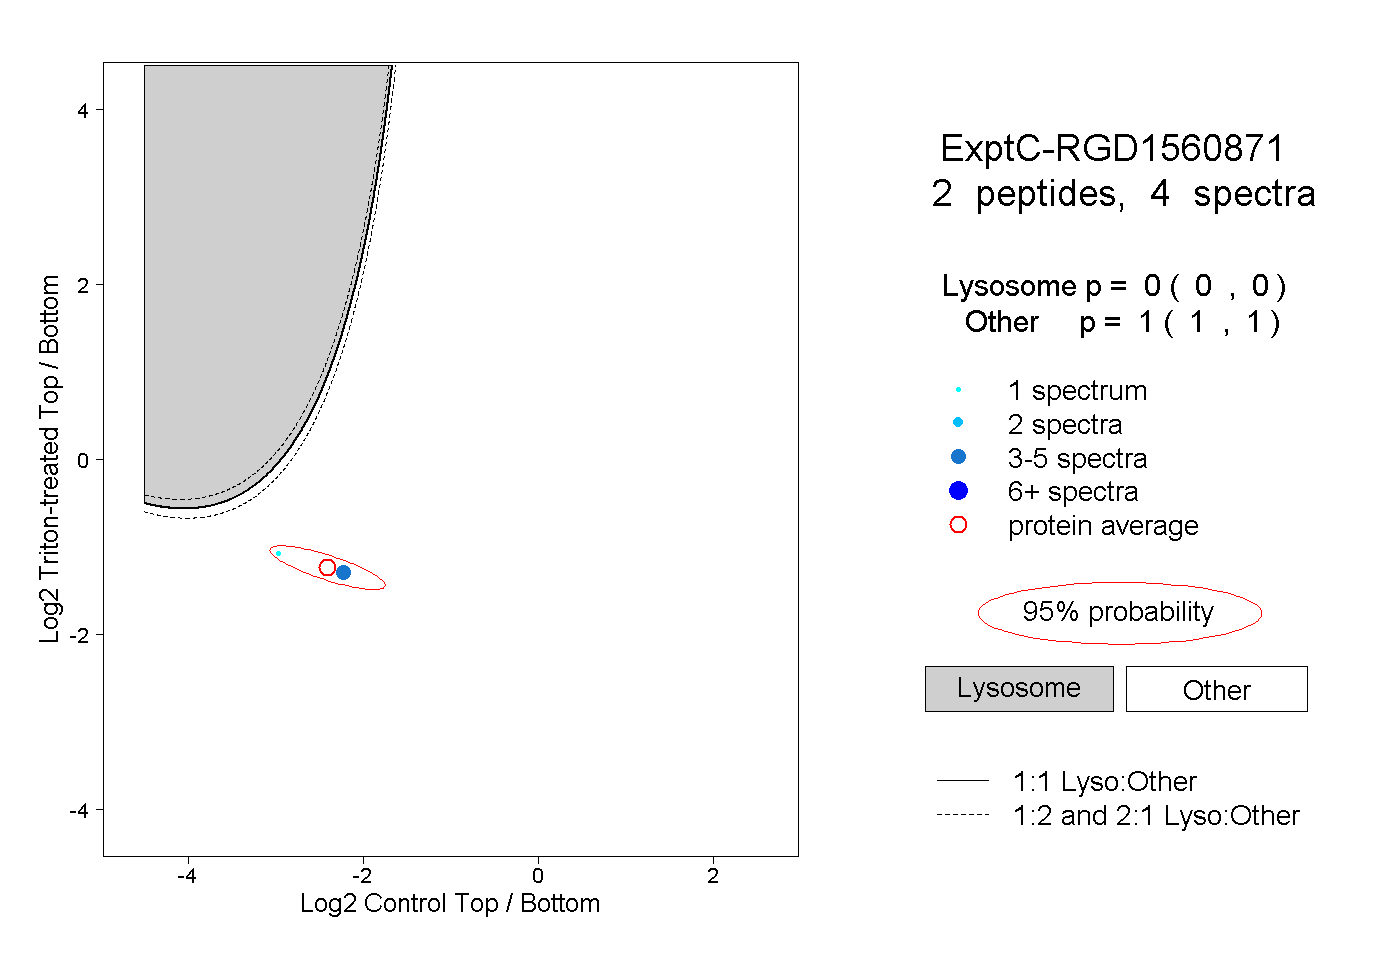
0.000 | 0.000
1.000 | 1.000