 3
3peptides
spectra
0.000 | 0.133
0.000 | 0.193
0.007 | 0.416
0.000 | 0.116
0.000 | 0.273
0.055 | 0.606
0.010 | 0.249
0.000 | 0.030
| Plot | Mito | Lyso | Perox | ER | Golgi | PM | Cytosol | Nucleus | |||||
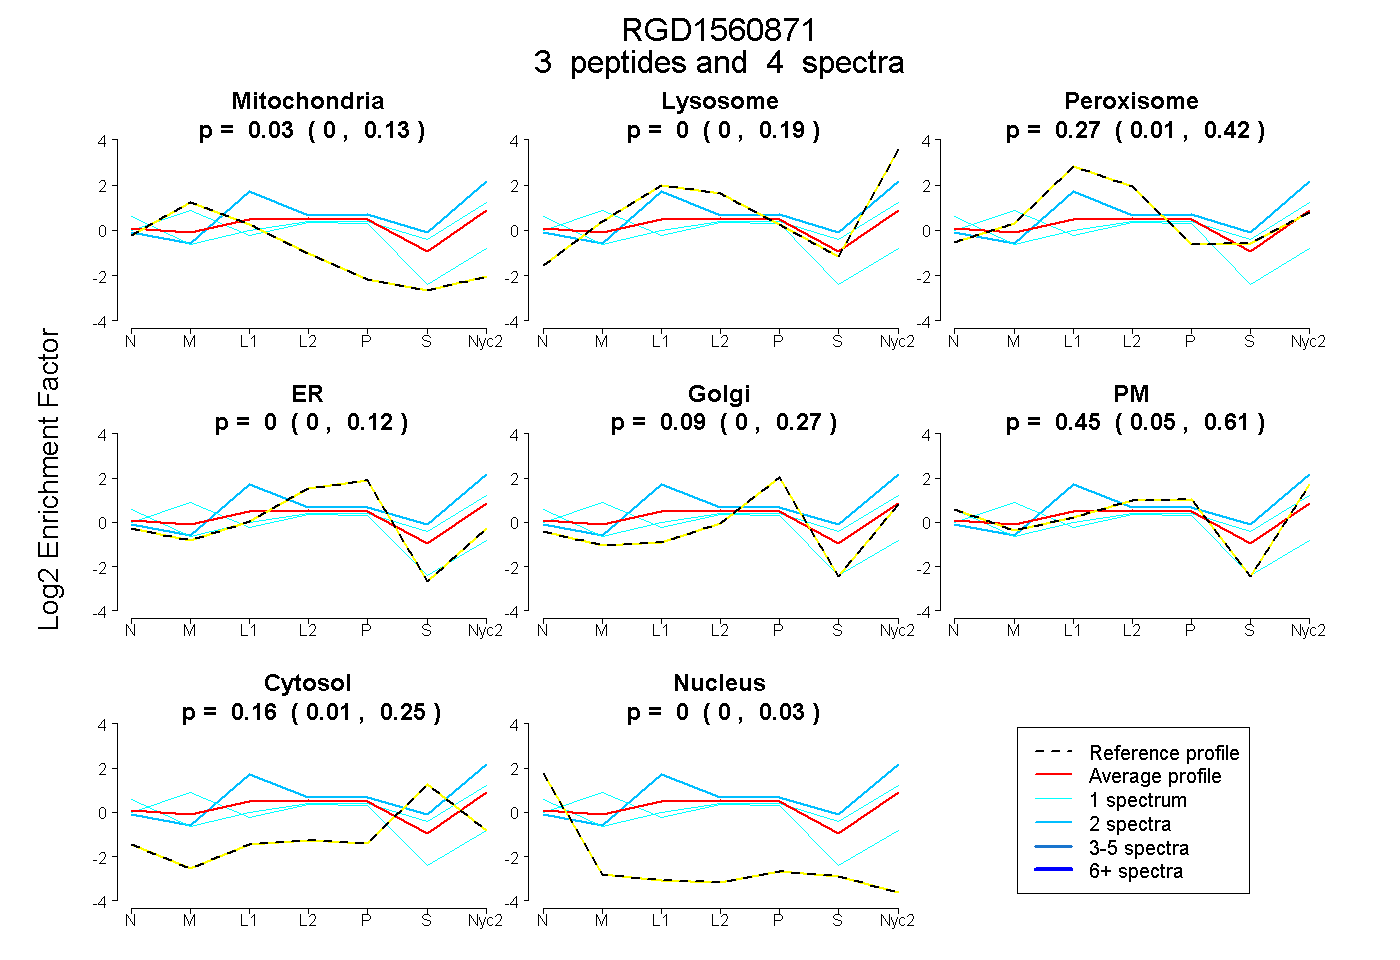
| Expt A |
3 peptides |
4 spectra |
|
0.027 0.000 | 0.133 |
0.000 0.000 | 0.193 |
0.274 0.007 | 0.416 |
0.000 0.000 | 0.116 |
0.091 0.000 | 0.273 |
0.449 0.055 | 0.606 |
0.159 0.010 | 0.249 |
0.000 0.000 | 0.030 |
| 2 spectra, EVAPITQGQGDQR | 0.000 | 0.399 | 0.221 | 0.000 | 0.000 | 0.223 | 0.157 | 0.000 | ||
| 1 spectrum, MPLPPLSPR | 0.442 | 0.000 | 0.000 | 0.379 | 0.057 | 0.122 | 0.000 | 0.000 | ||
| 1 spectrum, LDDLFK | 0.000 | 0.003 | 0.115 | 0.000 | 0.000 | 0.609 | 0.273 | 0.000 |
| Plot | Mito | Lyso or Perox | ER | Golgi | PM | Cytosol | Nucleus | ||||||
| Expt B |
2 peptides |
7 spectra |
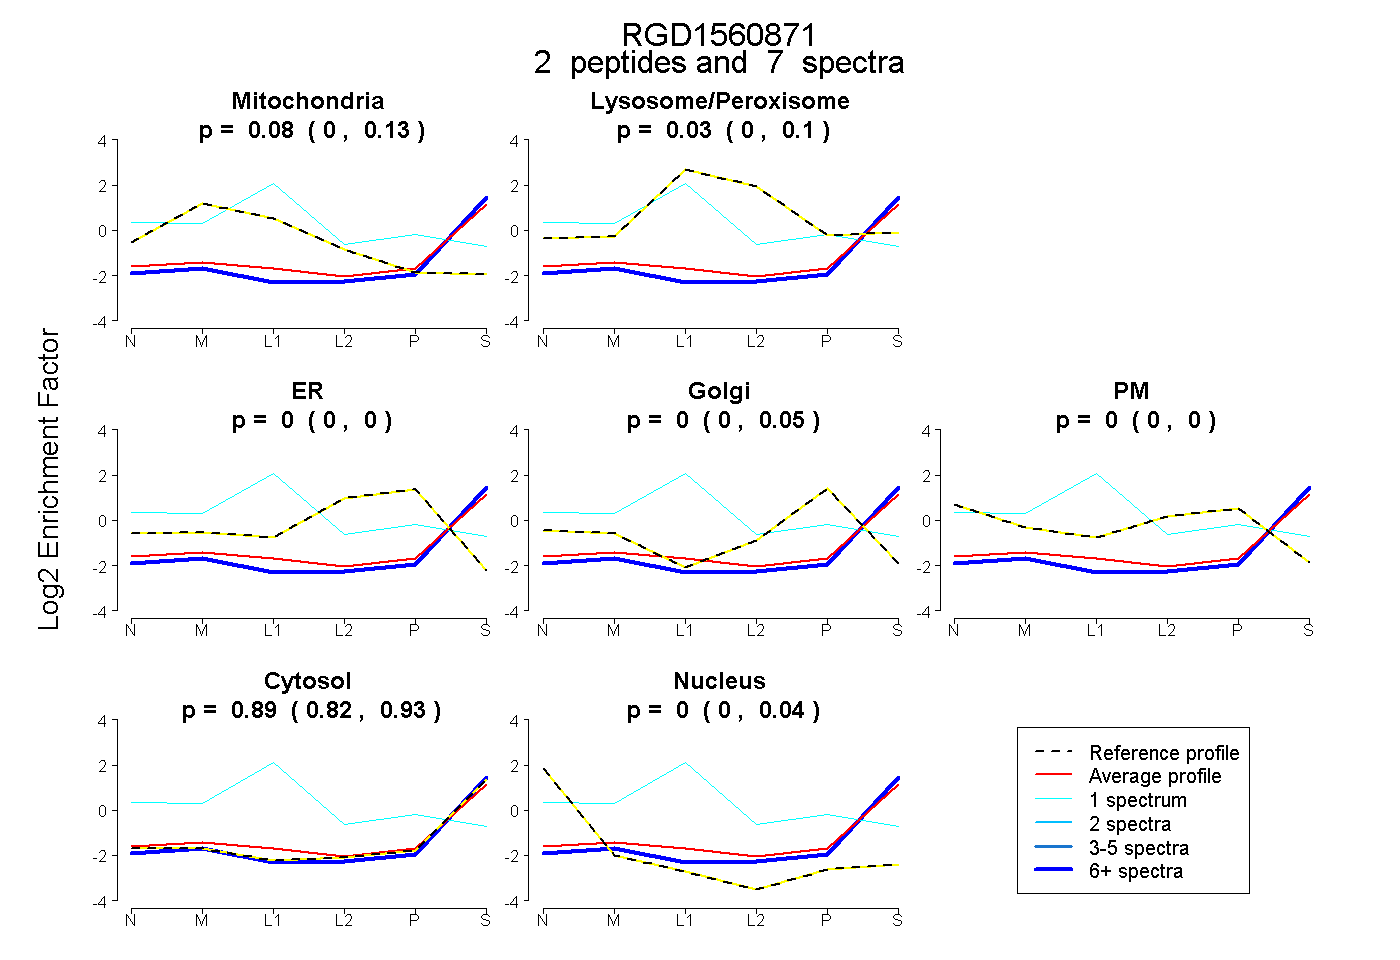 |
0.078 0.000 | 0.125 |
0.033 0.000 | 0.096 |
0.000 0.000 | 0.000 |
0.000 0.000 | 0.048 |
0.000 0.000 | 0.000 |
0.890 0.817 | 0.932 |
0.000 0.000 | 0.038 |
|||
| Plot | Lyso | Other | |||||||||||
| Expt C |
2 peptides |
4 spectra |
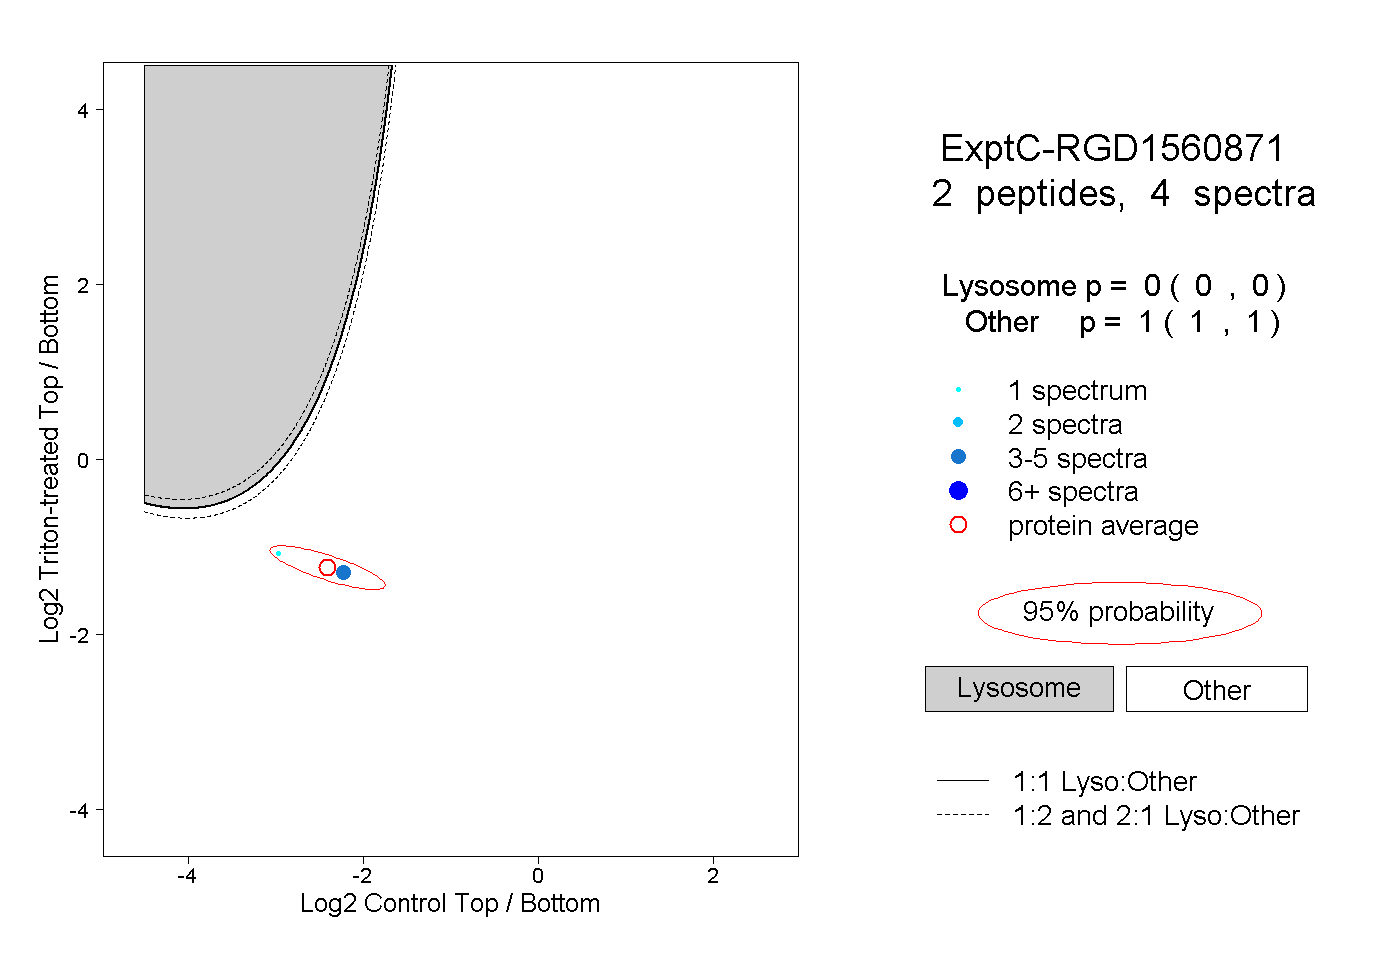 |
0.000 0.000 | 0.000 |
1.000 1.000 | 1.000 |