 16
16peptides
spectra
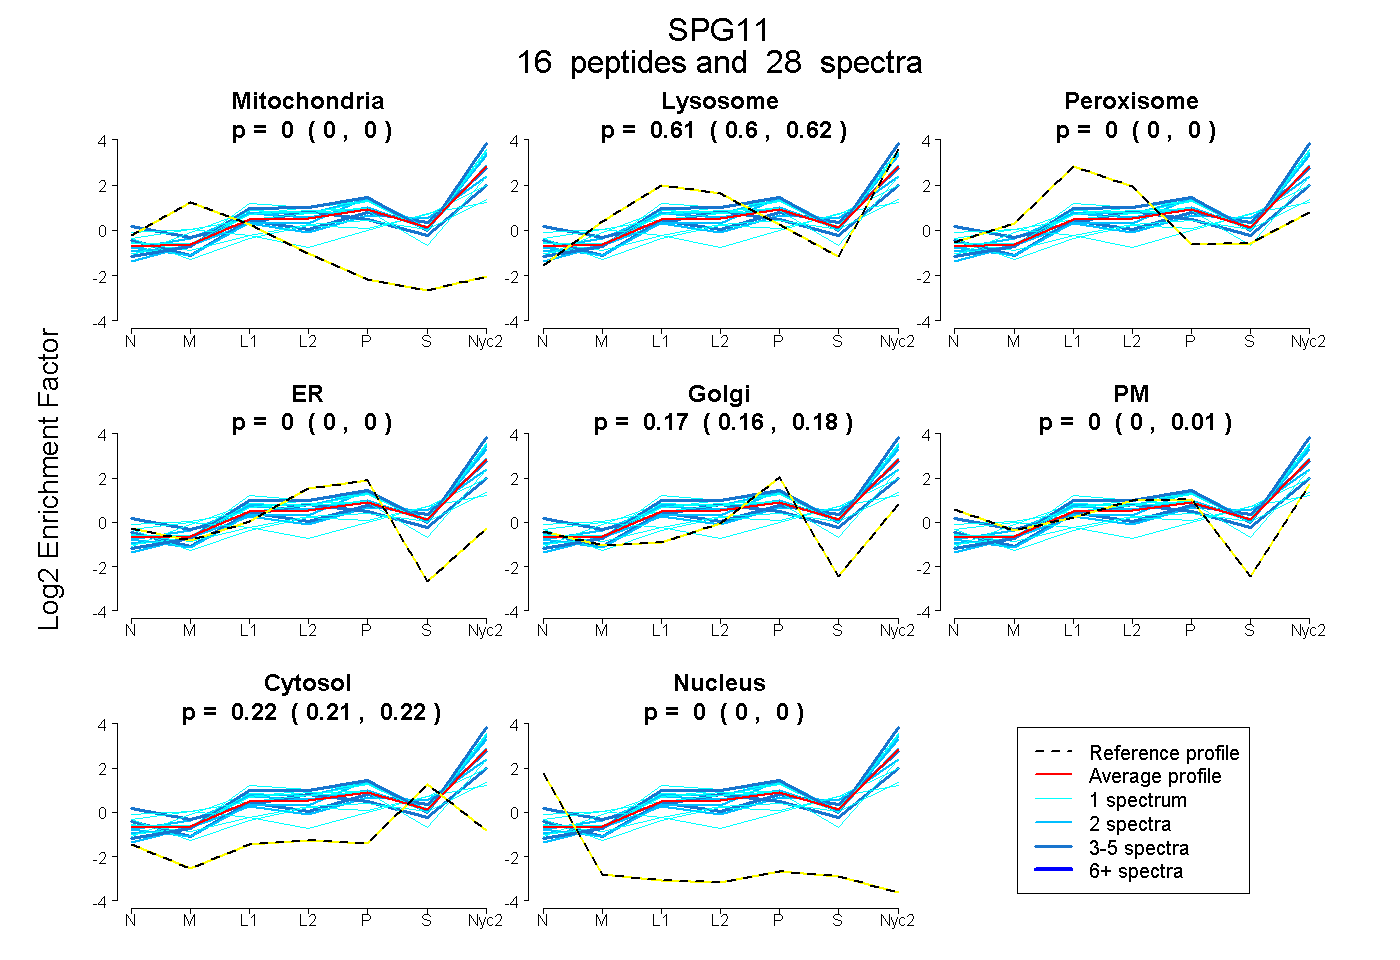
0.000 | 0.000
0.601 | 0.621
0.000 | 0.000
0.000 | 0.000
0.157 | 0.178
0.000 | 0.007
0.210 | 0.224
0.000 | 0.000
4peptides
spectra
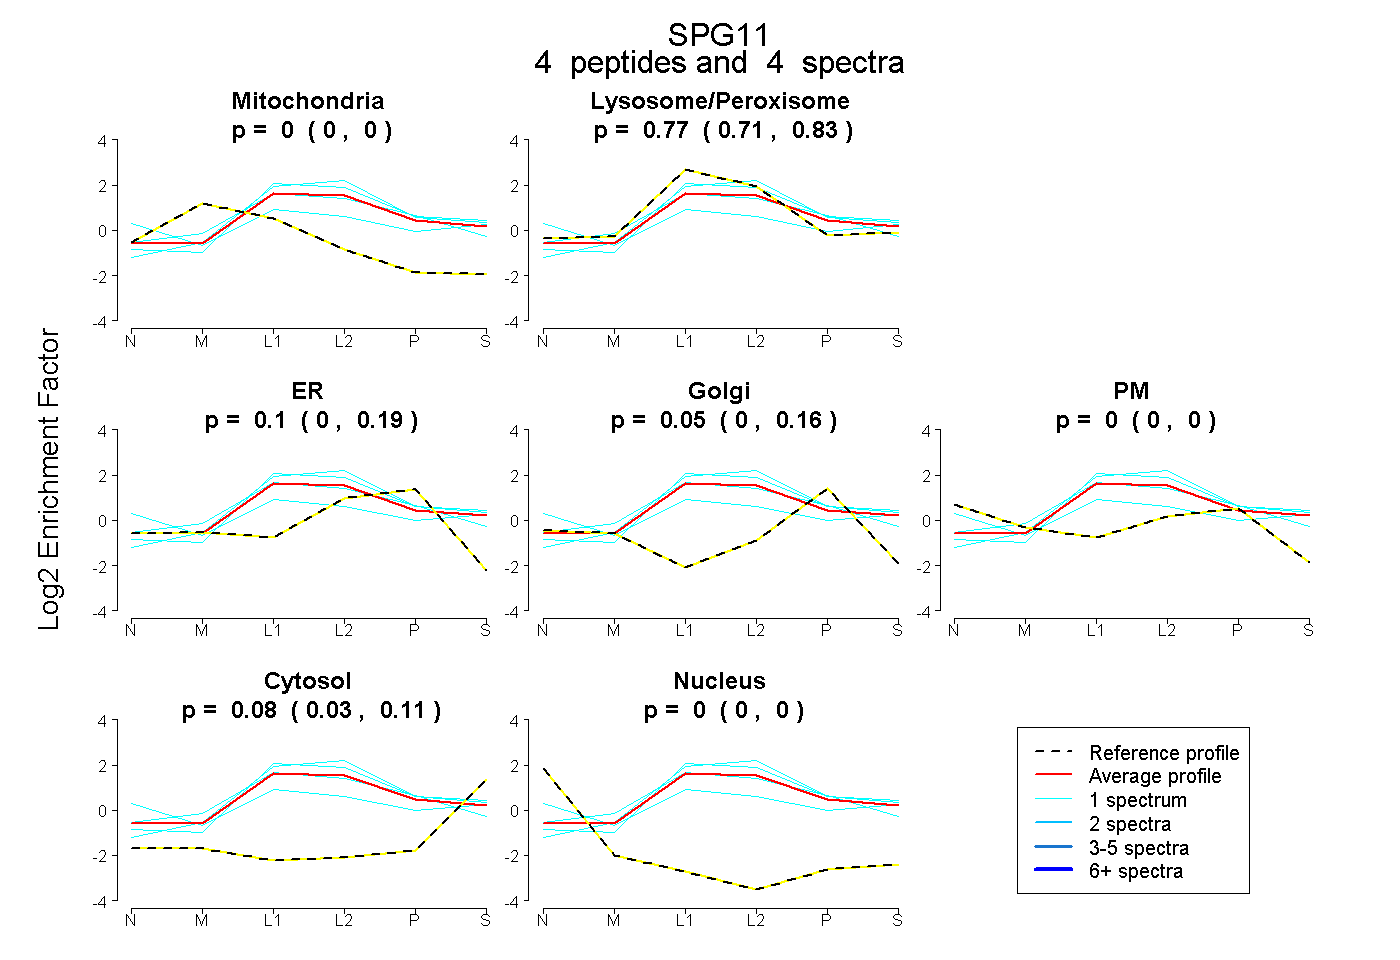
0.000 | 0.000
0.707 | 0.826
0.000 | 0.192
0.000 | 0.163
0.000 | 0.000
0.027 | 0.112
0.000 | 0.000
19peptides
spectra
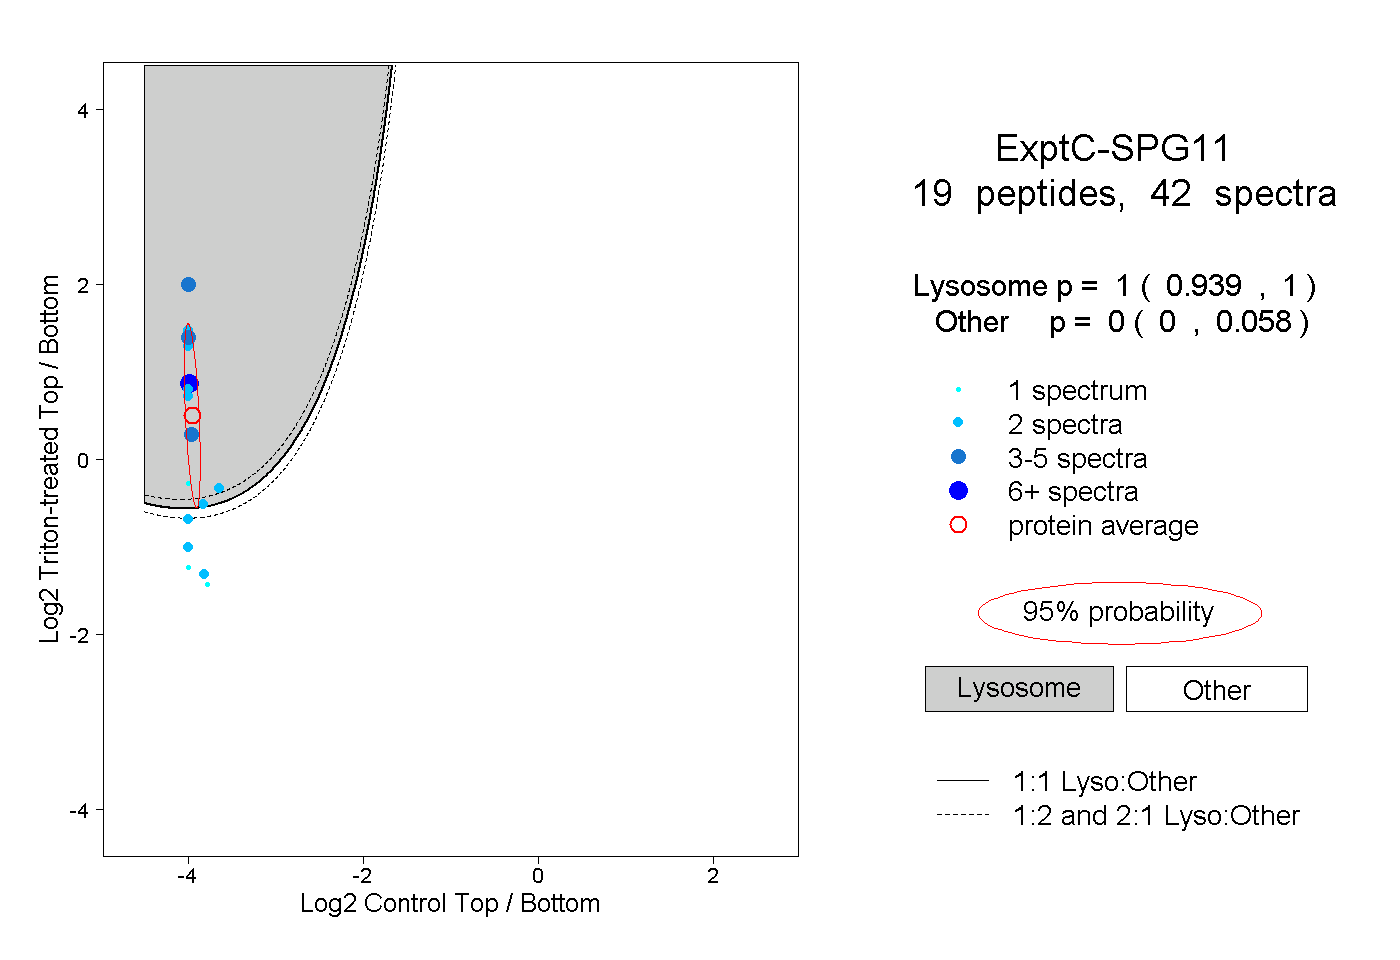
0.939 | 1.000
0.000 | 0.058
3peptides
spectra
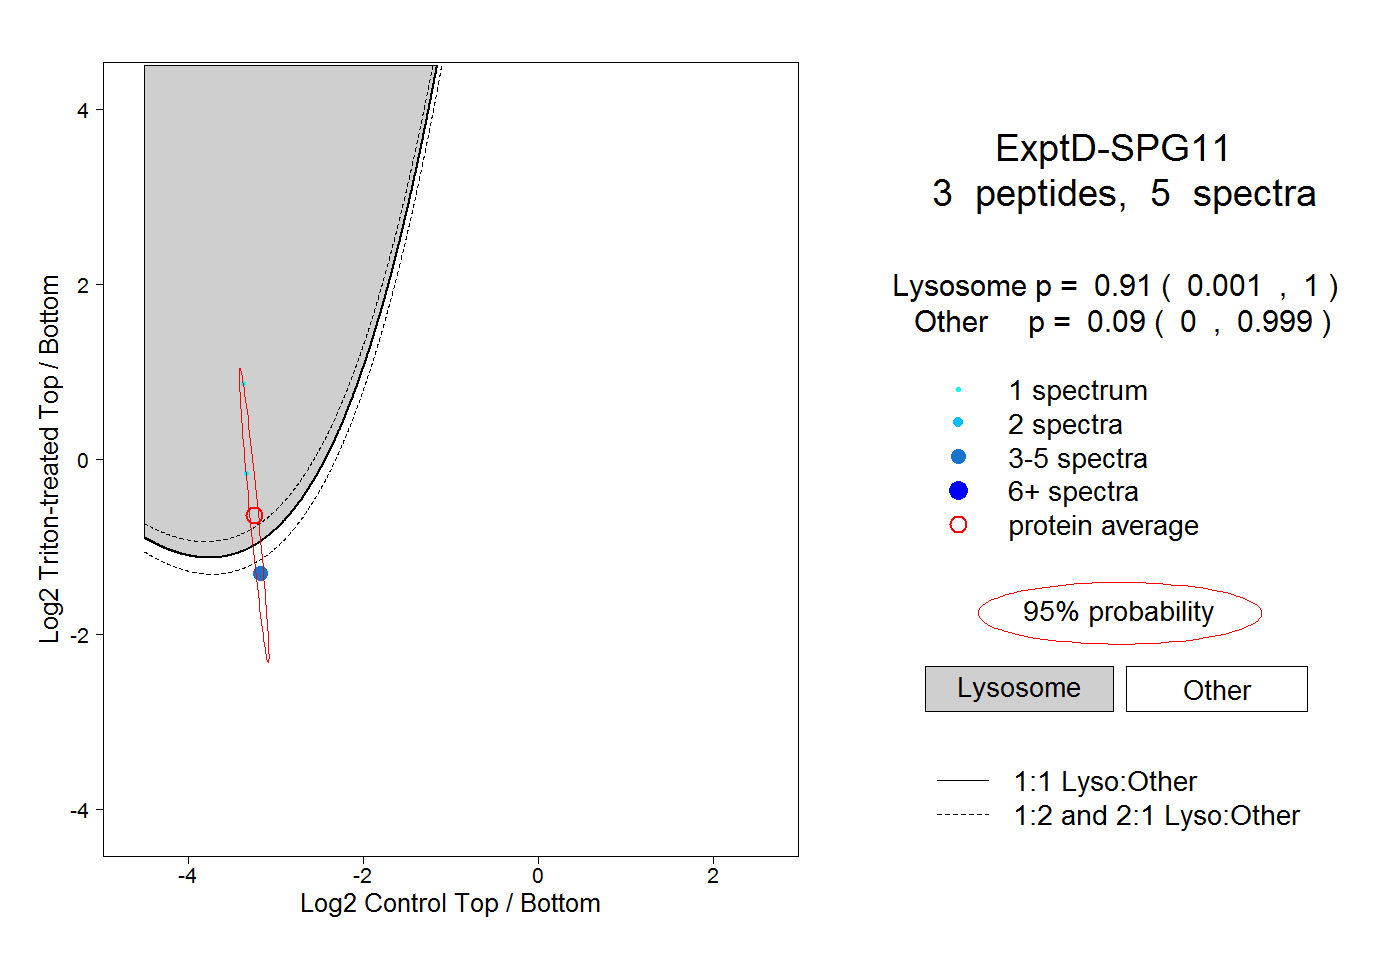
0.001 | 1.000
0.000 | 0.999