 16
16peptides
spectra
0.000 | 0.000
0.601 | 0.621
0.000 | 0.000
0.000 | 0.000
0.157 | 0.178
0.000 | 0.007
0.210 | 0.224
0.000 | 0.000
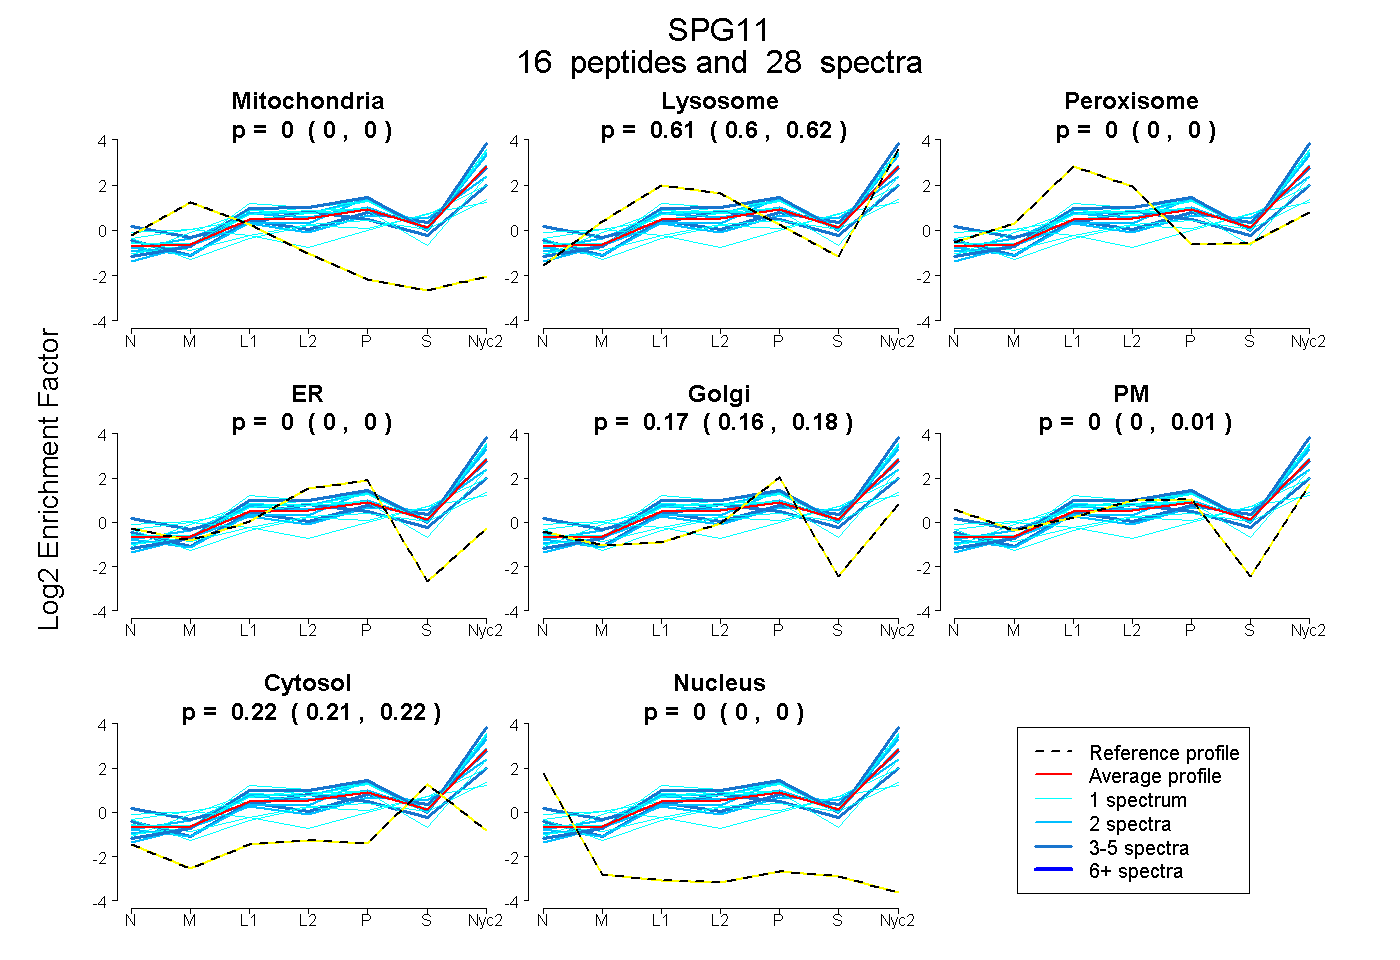
| Plot | Mito | Lyso | Perox | ER | Golgi | PM | Cytosol | Nucleus | |||||
| Expt A |
16 peptides |
28 spectra |
|
0.000 0.000 | 0.000 |
0.612 0.601 | 0.621 |
0.000 0.000 | 0.000 |
0.000 0.000 | 0.000 |
0.170 0.157 | 0.178 |
0.000 0.000 | 0.007 |
0.218 0.210 | 0.224 |
0.000 0.000 | 0.000 |
| 3 spectra, HYFEVLMR | 0.000 | 0.523 | 0.000 | 0.000 | 0.111 | 0.068 | 0.298 | 0.000 | ||
| 1 spectrum, VYSQDLVLLLHCR | 0.000 | 0.282 | 0.000 | 0.000 | 0.000 | 0.370 | 0.348 | 0.000 | ||
| 2 spectra, IPEAQTFFR | 0.000 | 0.527 | 0.000 | 0.000 | 0.280 | 0.000 | 0.193 | 0.000 | ||
| 1 spectrum, LDFWR | 0.000 | 0.727 | 0.000 | 0.000 | 0.142 | 0.000 | 0.131 | 0.000 | ||
| 1 spectrum, NSVEEASR | 0.000 | 0.712 | 0.000 | 0.000 | 0.089 | 0.039 | 0.160 | 0.000 | ||
| 1 spectrum, LSVSYLR | 0.000 | 0.282 | 0.000 | 0.000 | 0.000 | 0.167 | 0.551 | 0.000 | ||
| 1 spectrum, VLPVIPATWMR | 0.000 | 0.701 | 0.000 | 0.000 | 0.183 | 0.000 | 0.116 | 0.000 | ||
| 1 spectrum, SLEMLDTVATR | 0.000 | 0.785 | 0.000 | 0.000 | 0.082 | 0.000 | 0.133 | 0.000 | ||
| 5 spectra, VLPMLLVR | 0.000 | 0.778 | 0.000 | 0.000 | 0.140 | 0.000 | 0.082 | 0.000 | ||
| 2 spectra, DDSCLQELQK | 0.000 | 0.557 | 0.000 | 0.000 | 0.083 | 0.000 | 0.360 | 0.000 | ||
| 3 spectra, IPAEETAQLGPR | 0.000 | 0.304 | 0.050 | 0.000 | 0.000 | 0.429 | 0.217 | 0.000 | ||
| 1 spectrum, GAAILTSYINELR | 0.000 | 0.816 | 0.000 | 0.000 | 0.079 | 0.000 | 0.106 | 0.000 | ||
| 1 spectrum, VSFQVDR | 0.000 | 0.401 | 0.000 | 0.000 | 0.000 | 0.466 | 0.133 | 0.000 | ||
| 2 spectra, DFLVEILK | 0.000 | 0.694 | 0.000 | 0.000 | 0.186 | 0.000 | 0.120 | 0.000 | ||
| 1 spectrum, SEEVIADAILNNR | 0.000 | 0.351 | 0.000 | 0.000 | 0.000 | 0.186 | 0.463 | 0.000 | ||
| 2 spectra, EGQVWEELR | 0.000 | 0.704 | 0.000 | 0.000 | 0.136 | 0.000 | 0.160 | 0.000 |
| Plot | Mito | Lyso or Perox | ER | Golgi | PM | Cytosol | Nucleus | ||||||
| Expt B |
4 peptides |
4 spectra |
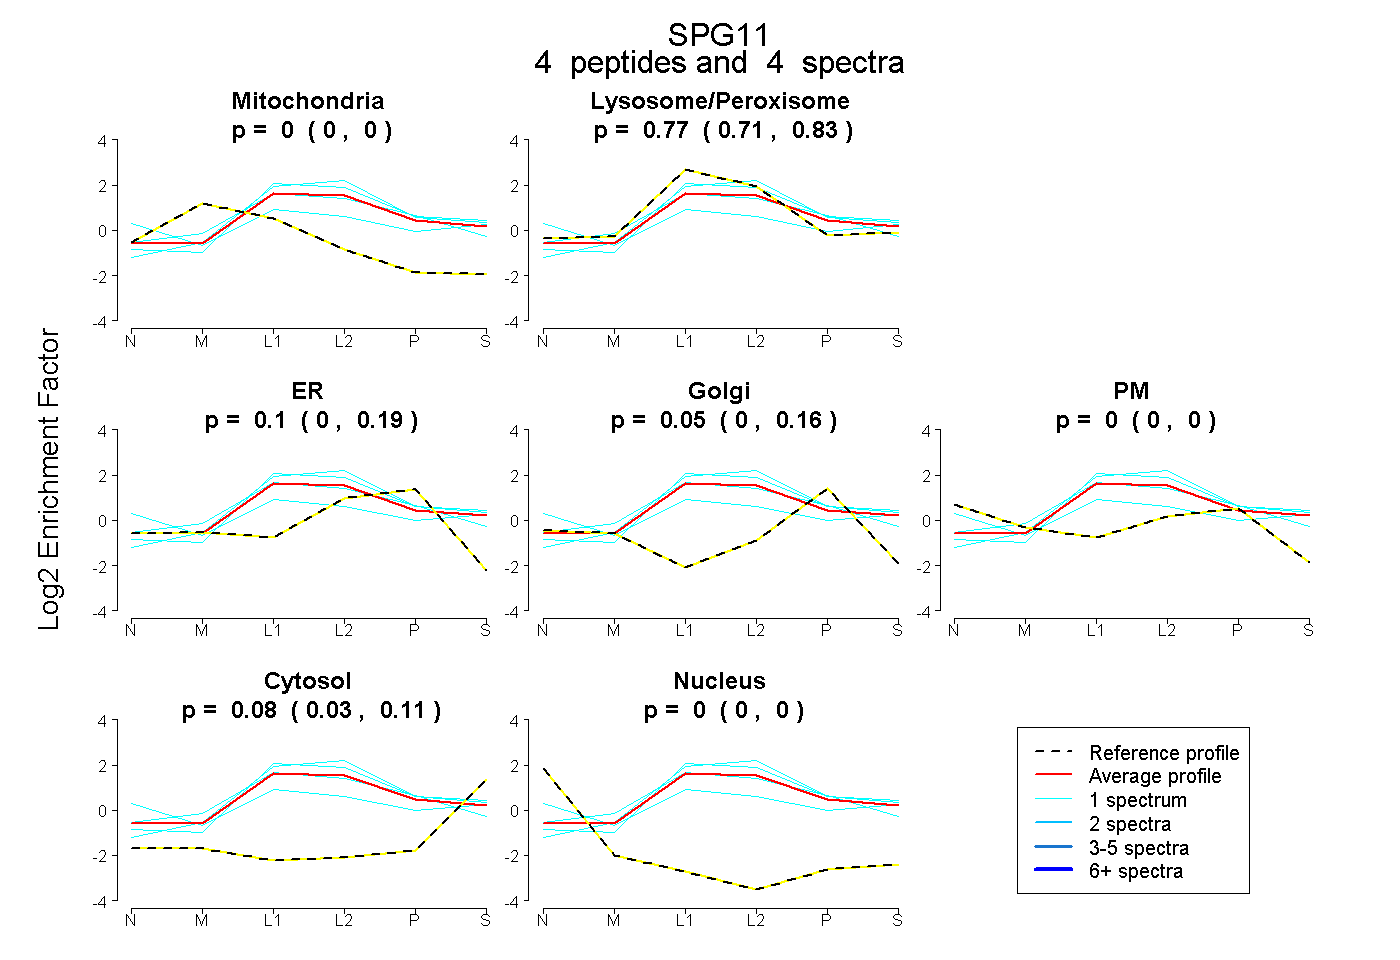 |
0.000 0.000 | 0.000 |
0.767 0.707 | 0.826 |
0.104 0.000 | 0.192 |
0.051 0.000 | 0.163 |
0.000 0.000 | 0.000 |
0.078 0.027 | 0.112 |
0.000 0.000 | 0.000 |
|||
| Plot | Lyso | Other | |||||||||||
| Expt C |
19 peptides |
42 spectra |
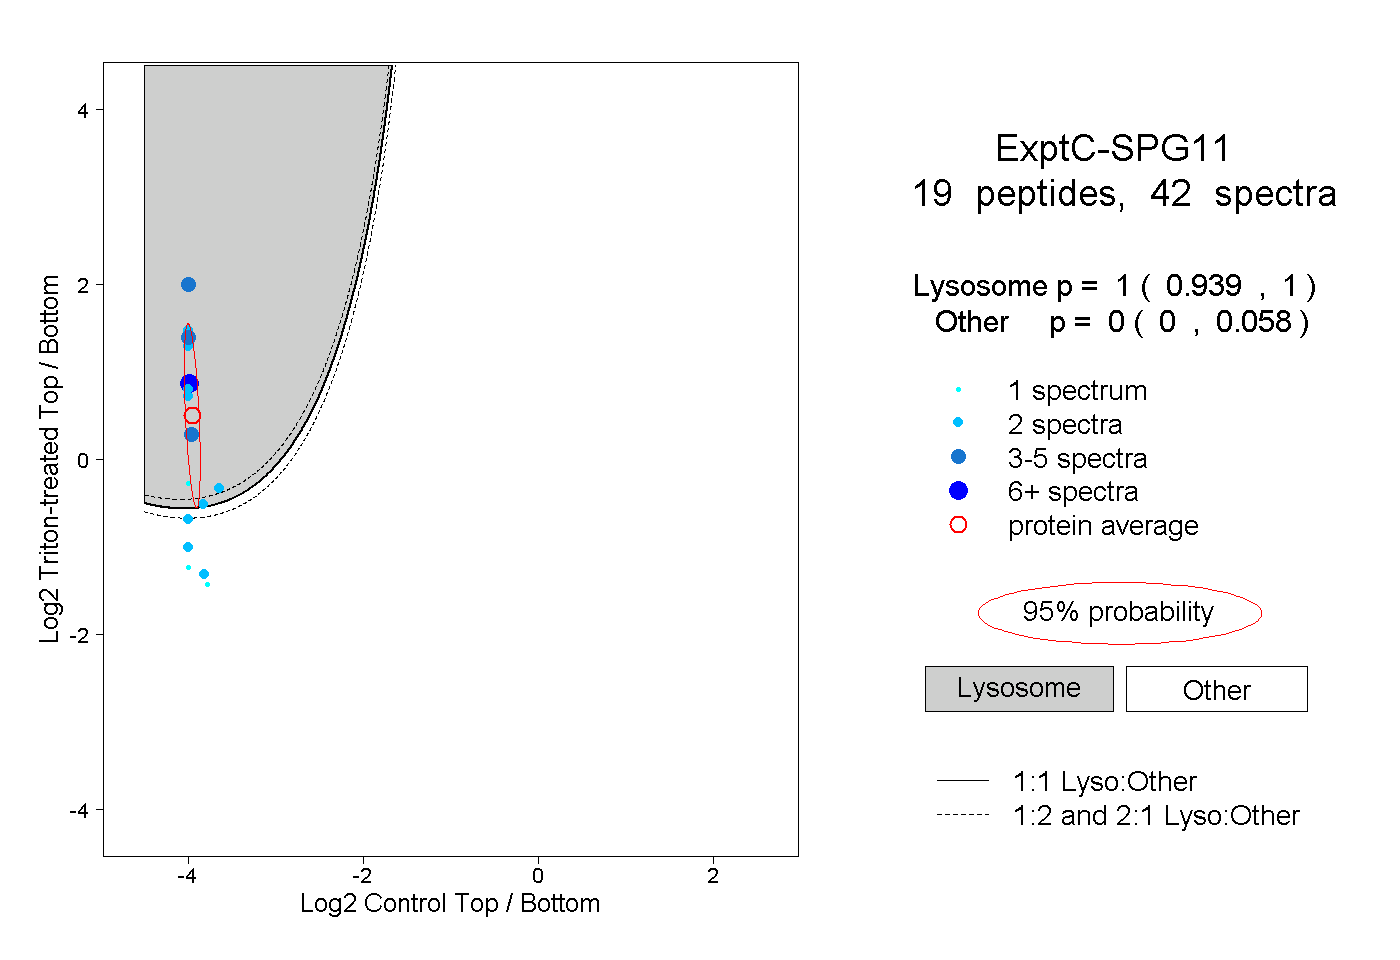 |
1.000 0.939 | 1.000 |
0.000 0.000 | 0.058 |
||||||||
| Plot | Lyso | Other | |||||||||||
| Expt D |
3 peptides |
5 spectra |
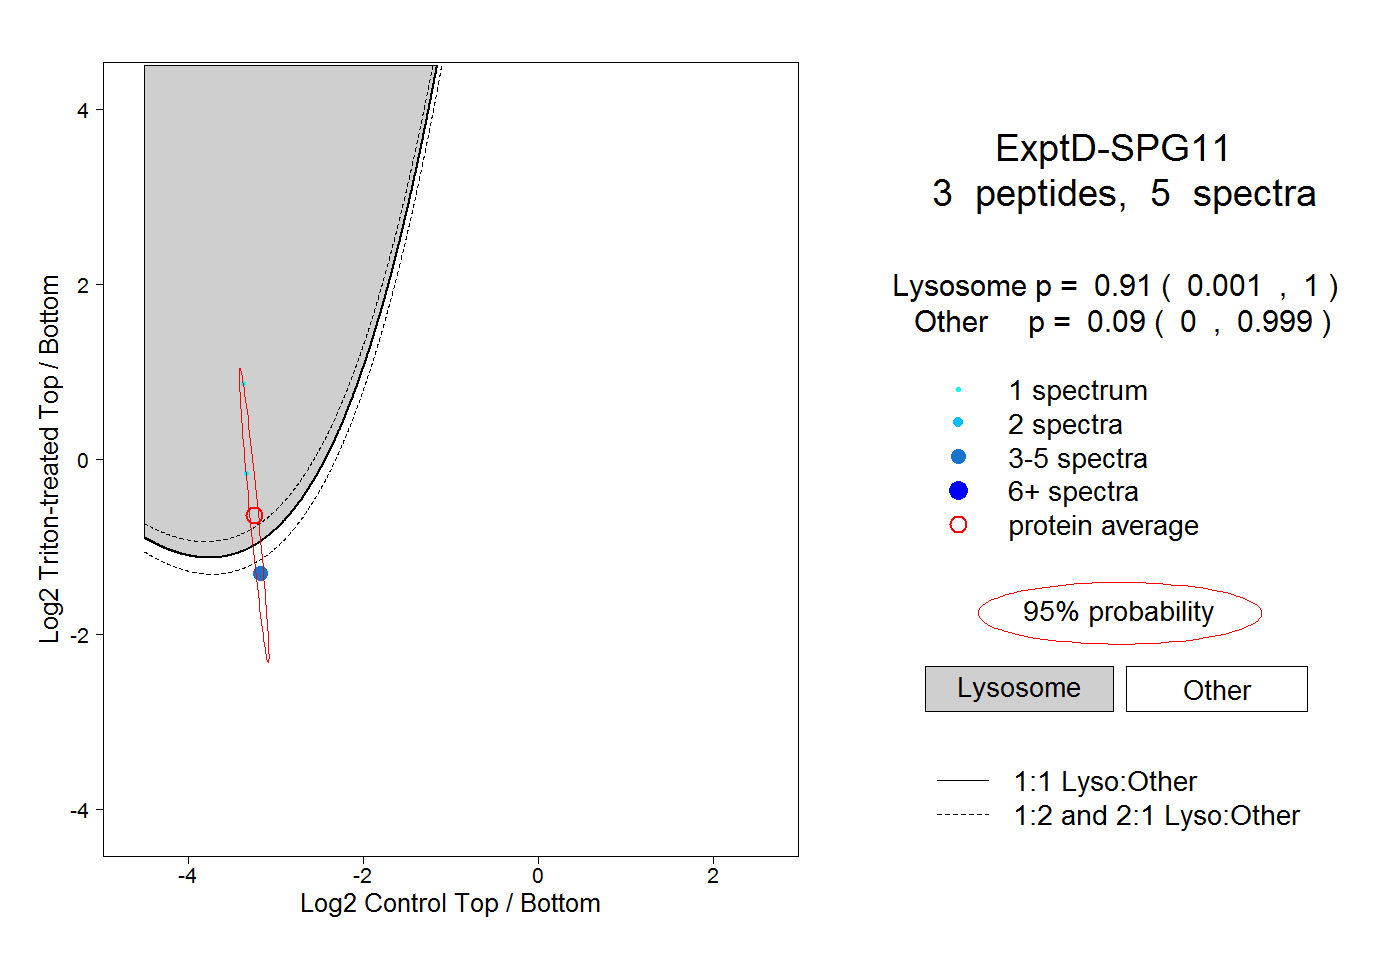 |
0.910 0.001 | 1.000 |
0.090 0.000 | 0.999 |