 17
17peptides
spectra
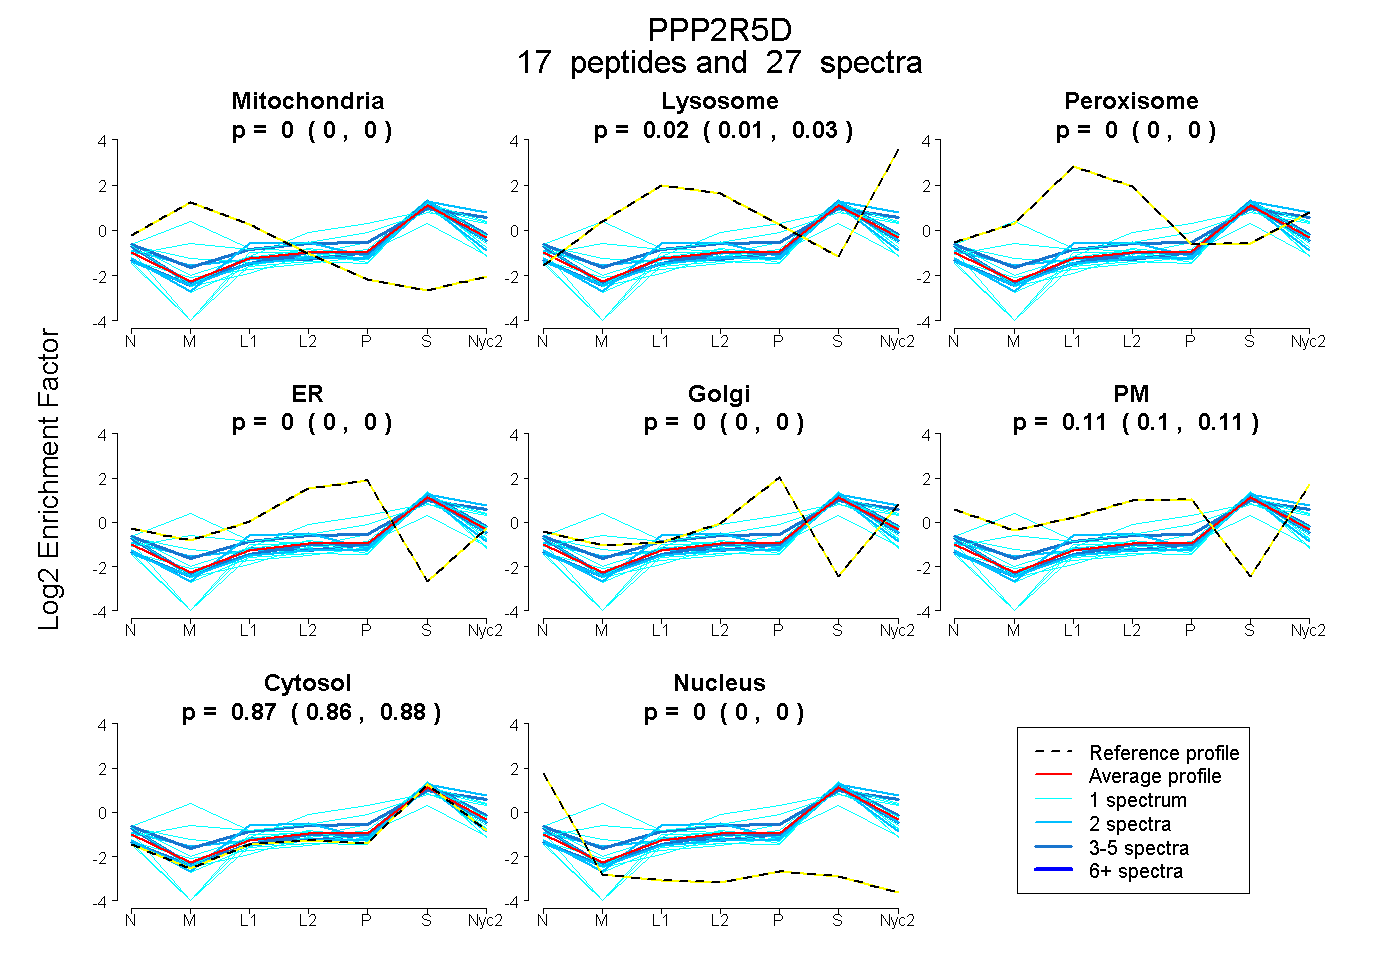
0.000 | 0.000
0.010 | 0.031
0.000 | 0.000
0.000 | 0.000
0.000 | 0.000
0.097 | 0.114
0.865 | 0.878
0.000 | 0.000
4peptides
spectra

0.000 | 0.000
0.000 | 0.060
0.000 | 0.000
0.000 | 0.006
0.000 | 0.105
0.867 | 0.924
0.000 | 0.048
5peptides
spectra
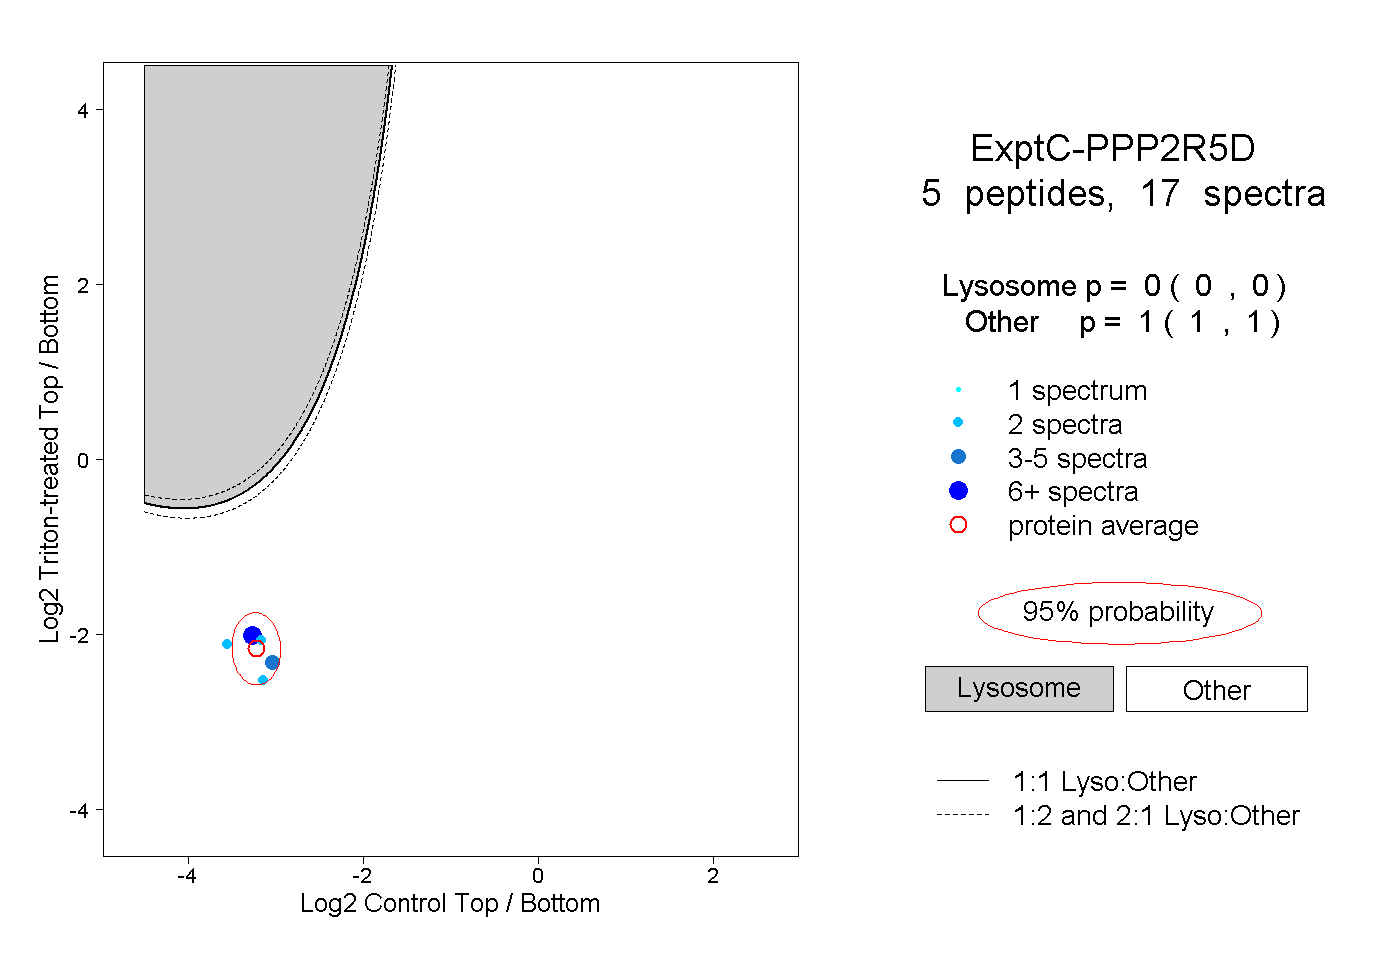
0.000 | 0.000
1.000 | 1.000
1peptide
spectrum
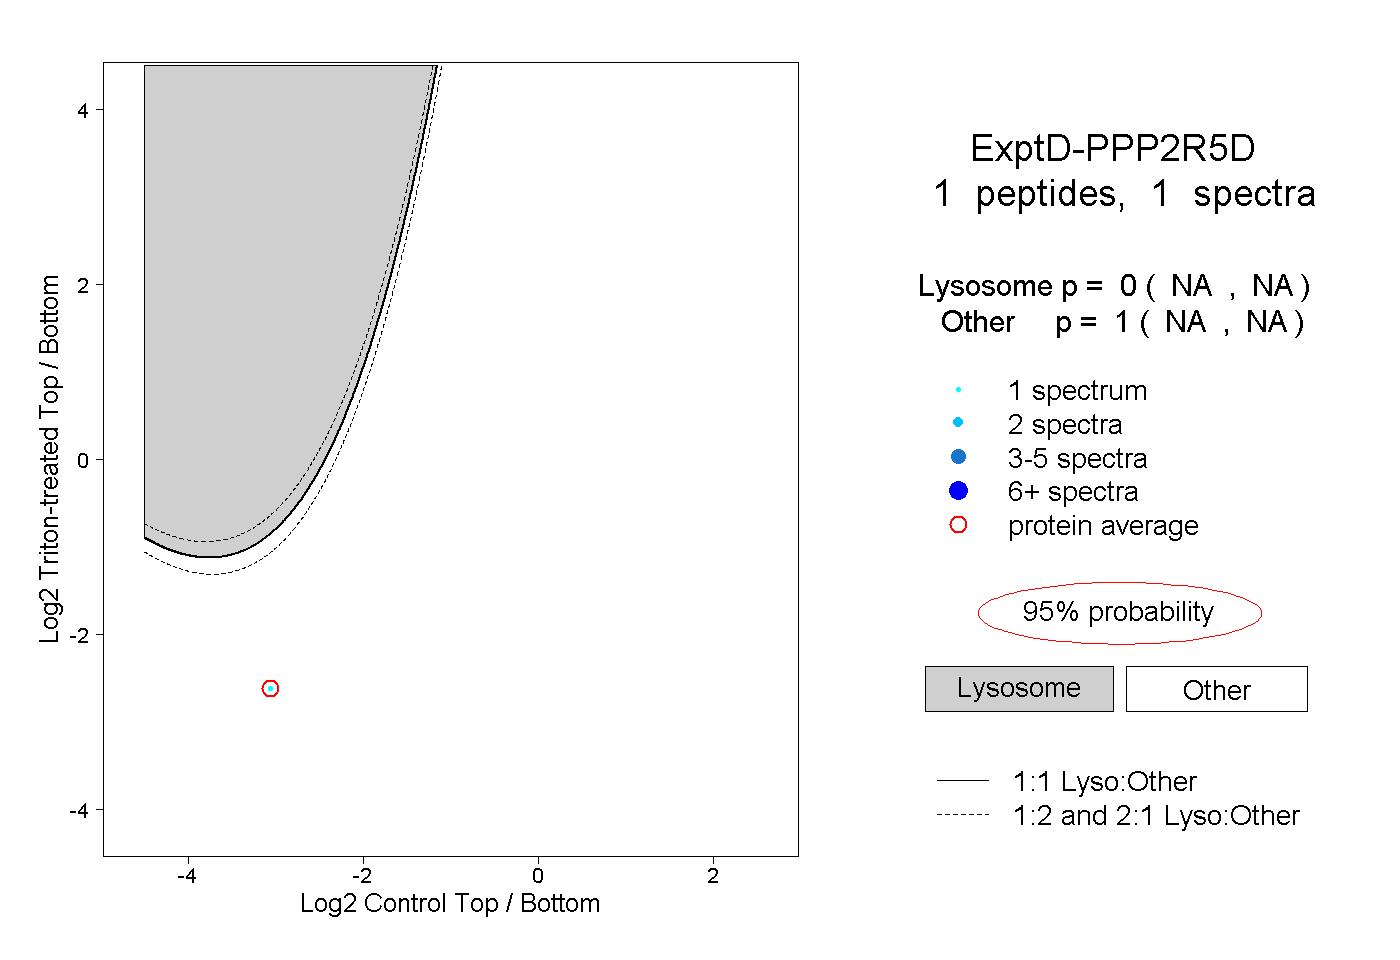
NA | NA
NA | NA