 17
17peptides
spectra
0.000 | 0.000
0.010 | 0.031
0.000 | 0.000
0.000 | 0.000
0.000 | 0.000
0.097 | 0.114
0.865 | 0.878
0.000 | 0.000
| Plot | Mito | Lyso | Perox | ER | Golgi | PM | Cytosol | Nucleus | |||||
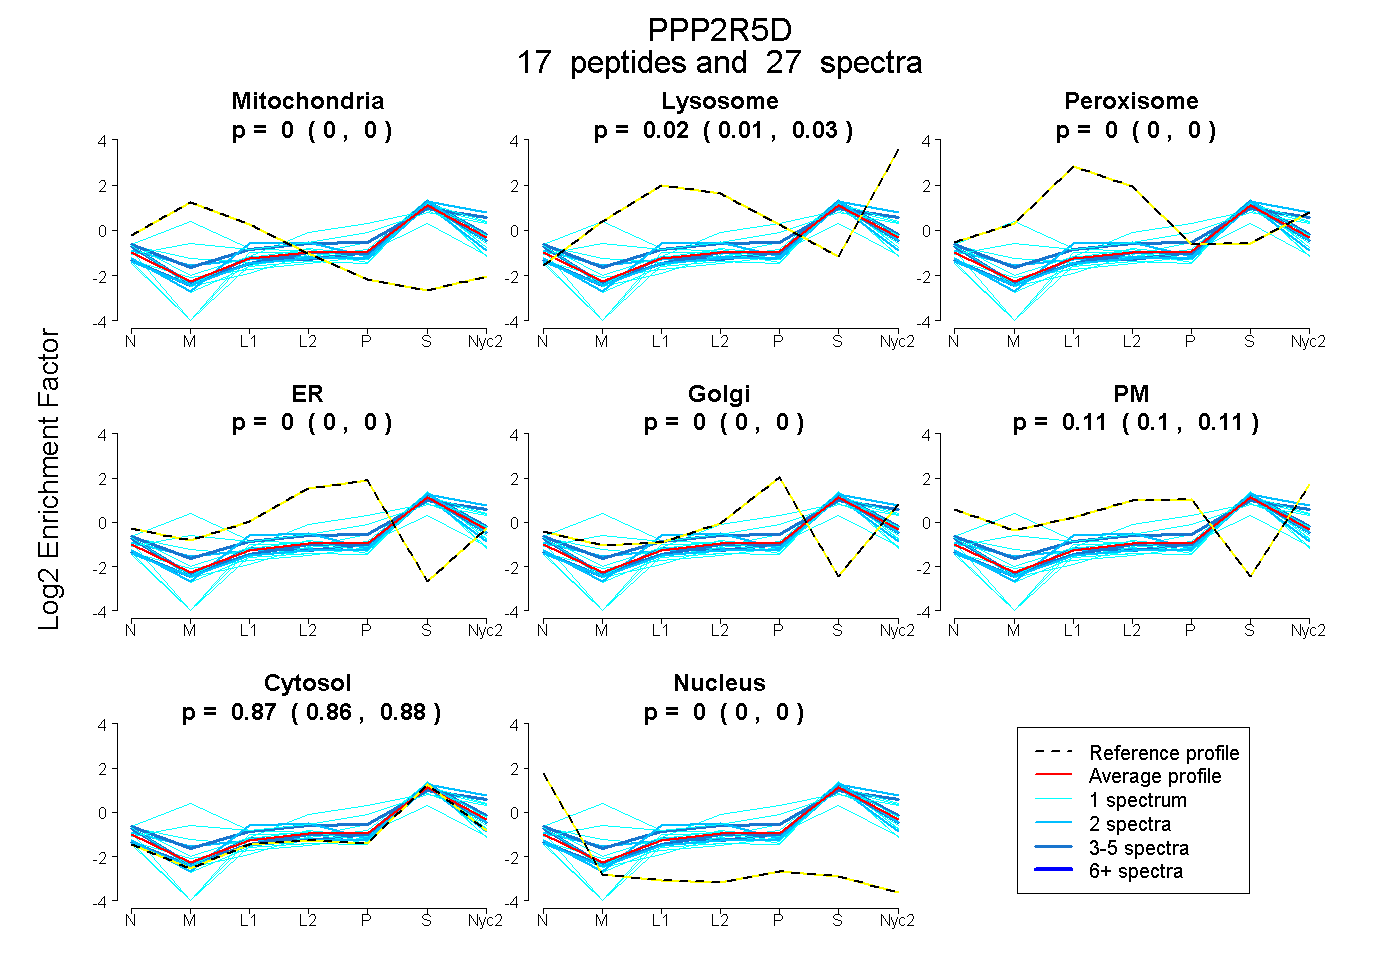
| Expt A |
17 peptides |
27 spectra |
|
0.000 0.000 | 0.000 |
0.021 0.010 | 0.031 |
0.000 0.000 | 0.000 |
0.000 0.000 | 0.000 |
0.000 0.000 | 0.000 |
0.107 0.097 | 0.114 |
0.872 0.865 | 0.878 |
0.000 0.000 | 0.000 |
| 4 spectra, VLLPLHK | 0.000 | 0.000 | 0.000 | 0.000 | 0.000 | 0.109 | 0.886 | 0.005 | ||
| 2 spectra, VMEPLFR | 0.000 | 0.034 | 0.000 | 0.000 | 0.006 | 0.000 | 0.960 | 0.000 | ||
| 3 spectra, LNPQYPMFR | 0.000 | 0.078 | 0.000 | 0.000 | 0.013 | 0.000 | 0.909 | 0.000 | ||
| 1 spectrum, GTAKPSSSSK | 0.000 | 0.000 | 0.000 | 0.000 | 0.000 | 0.000 | 1.000 | 0.000 | ||
| 1 spectrum, YSGGPQIVK | 0.036 | 0.232 | 0.000 | 0.000 | 0.137 | 0.000 | 0.595 | 0.000 | ||
| 1 spectrum, LFDDCTQQYK | 0.400 | 0.035 | 0.055 | 0.000 | 0.031 | 0.000 | 0.479 | 0.000 | ||
| 1 spectrum, ESSLTEPVIVGLLK | 0.000 | 0.000 | 0.000 | 0.000 | 0.000 | 0.000 | 0.980 | 0.020 | ||
| 3 spectra, TIHGLIYNALK | 0.000 | 0.151 | 0.000 | 0.000 | 0.000 | 0.148 | 0.700 | 0.000 | ||
| 1 spectrum, VLPIMFPALYR | 0.000 | 0.099 | 0.000 | 0.000 | 0.000 | 0.061 | 0.839 | 0.000 | ||
| 1 spectrum, SELPQDVYTIK | 0.000 | 0.000 | 0.000 | 0.000 | 0.136 | 0.000 | 0.848 | 0.016 | ||
| 1 spectrum, AGLNEMVEYITHSR | 0.026 | 0.000 | 0.000 | 0.000 | 0.002 | 0.000 | 0.947 | 0.026 | ||
| 1 spectrum, RPSNSTPPPTQLSK | 0.000 | 0.000 | 0.000 | 0.000 | 0.000 | 0.015 | 0.985 | 0.000 | ||
| 2 spectra, LFMEMNQK | 0.115 | 0.000 | 0.025 | 0.000 | 0.000 | 0.020 | 0.840 | 0.000 | ||
| 1 spectrum, QINHIFYR | 0.000 | 0.015 | 0.000 | 0.181 | 0.075 | 0.065 | 0.664 | 0.000 | ||
| 2 spectra, TVETEAVQMLK | 0.000 | 0.212 | 0.000 | 0.000 | 0.000 | 0.000 | 0.788 | 0.000 | ||
| 1 spectrum, EELFIQK | 0.002 | 0.100 | 0.000 | 0.000 | 0.000 | 0.135 | 0.763 | 0.000 | ||
| 1 spectrum, ALEAHK | 0.000 | 0.000 | 0.000 | 0.000 | 0.000 | 0.000 | 0.993 | 0.007 |
| Plot | Mito | Lyso or Perox | ER | Golgi | PM | Cytosol | Nucleus | ||||||
| Expt B |
4 peptides |
7 spectra |
 |
0.000 0.000 | 0.000 |
0.016 0.000 | 0.060 |
0.000 0.000 | 0.000 |
0.000 0.000 | 0.006 |
0.075 0.000 | 0.105 |
0.903 0.867 | 0.924 |
0.006 0.000 | 0.048 |
|||
| Plot | Lyso | Other | |||||||||||
| Expt C |
5 peptides |
17 spectra |
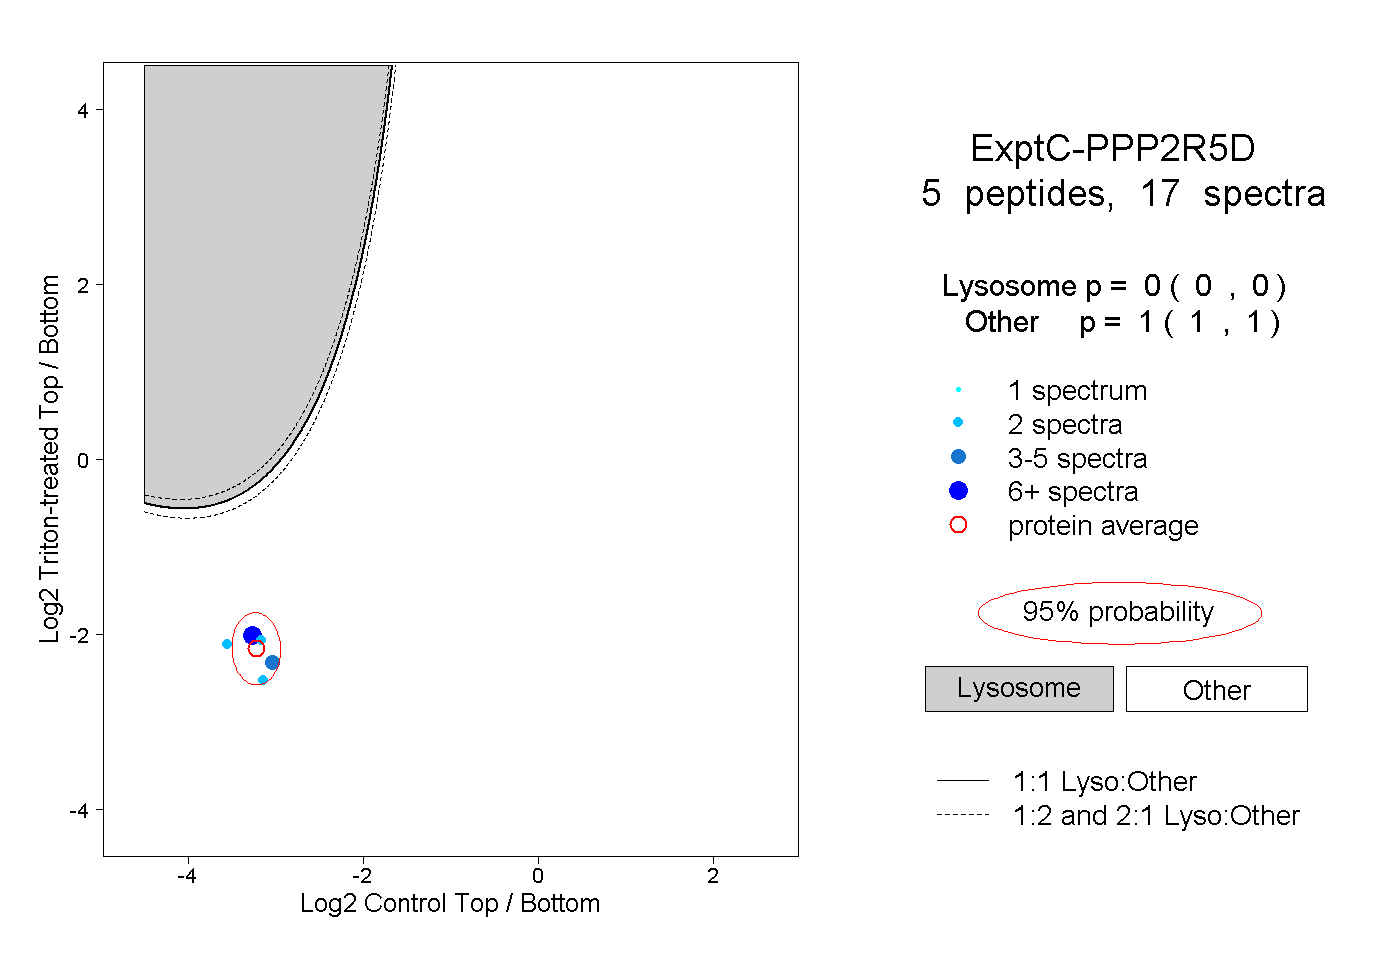 |
0.000 0.000 | 0.000 |
1.000 1.000 | 1.000 |
||||||||
| Plot | Lyso | Other | |||||||||||
| Expt D |
1 peptide |
1 spectrum |
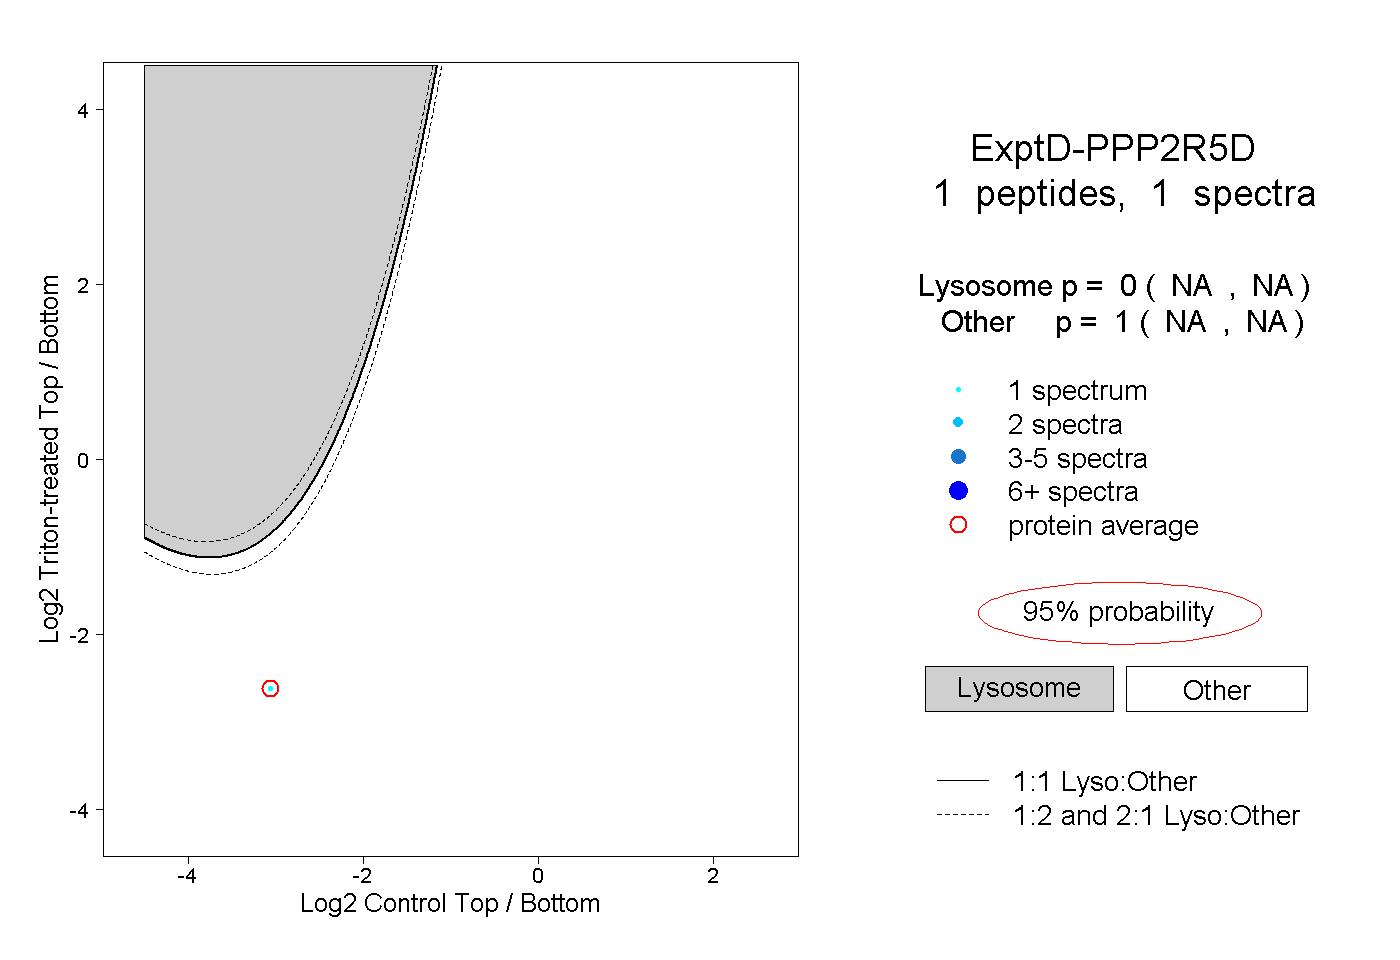 |
0.000 NA | NA |
1.000 NA | NA |