 7
7peptides
spectra
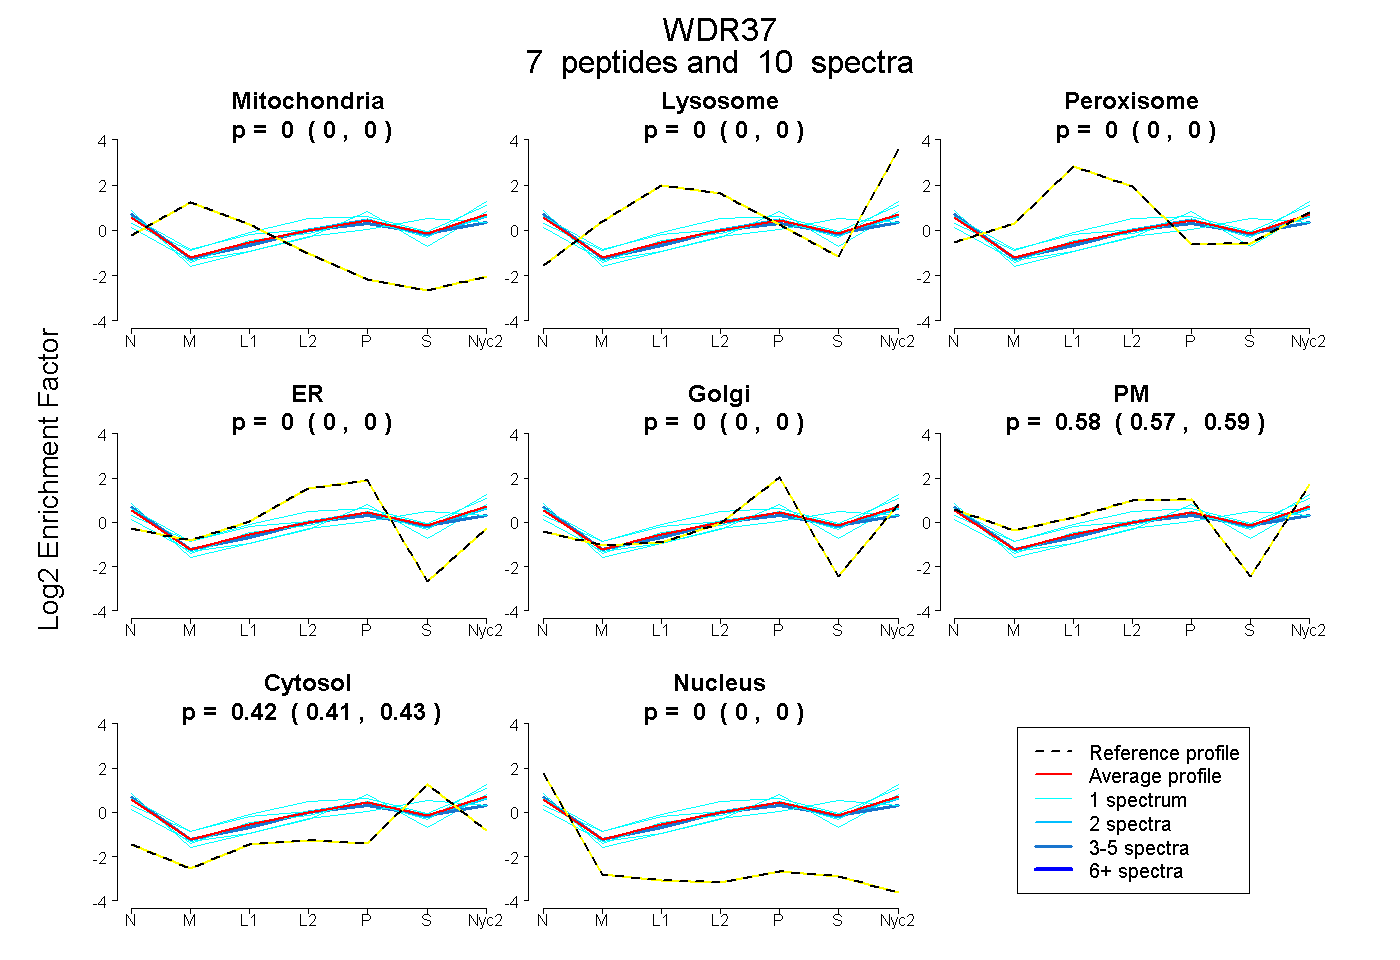
0.000 | 0.000
0.000 | 0.000
0.000 | 0.000
0.000 | 0.000
0.000 | 0.000
0.569 | 0.590
0.409 | 0.429
0.000 | 0.000
2peptides
spectra
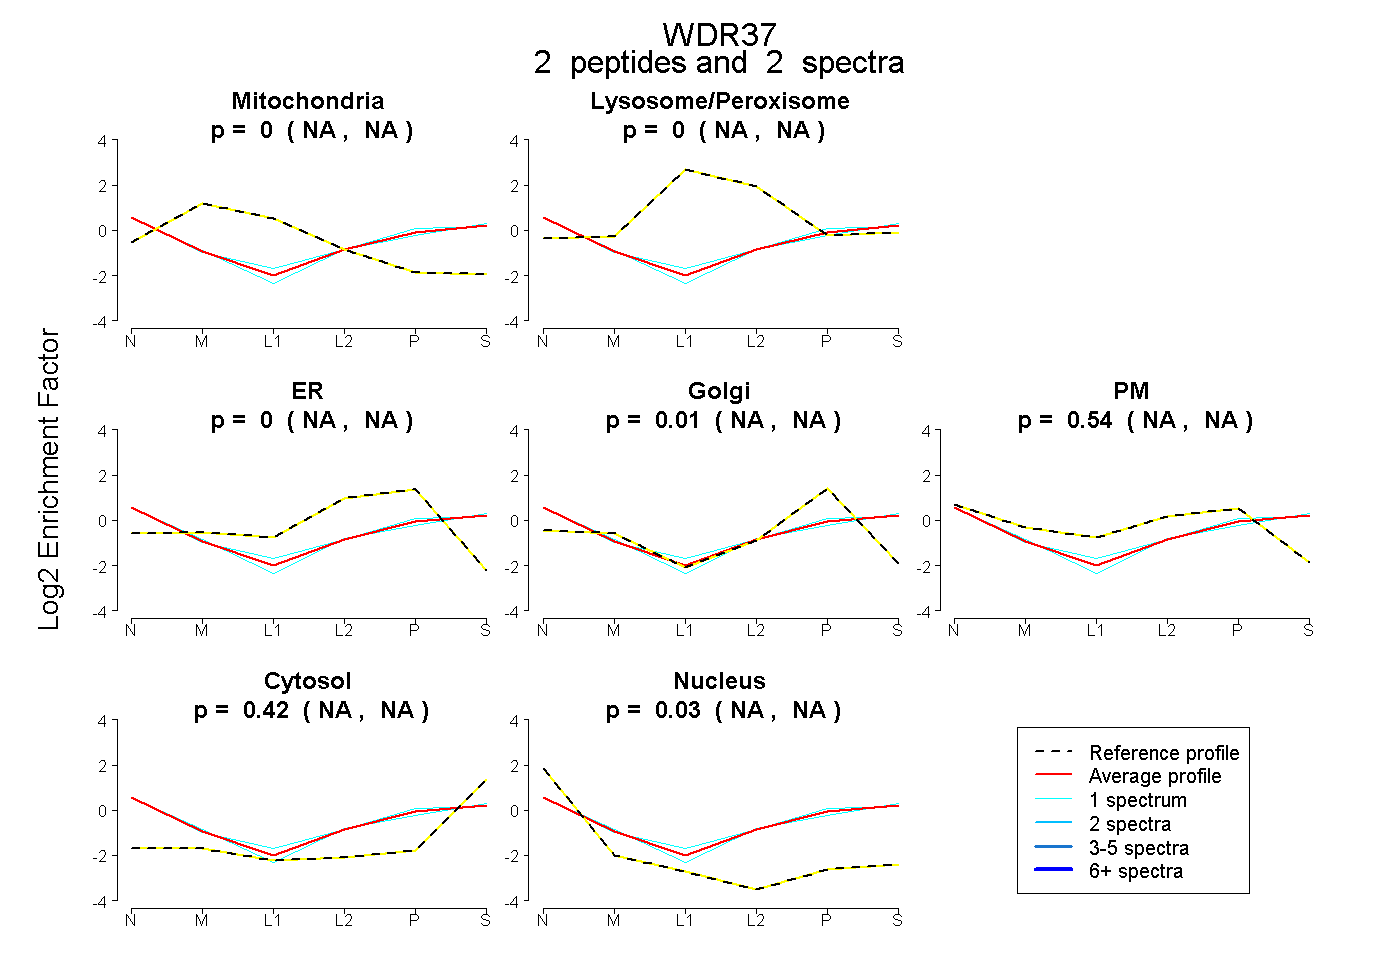
NA | NA
NA | NA
NA | NA
NA | NA
NA | NA
NA | NA
NA | NA
3peptides
spectra

0.000 | 0.099
0.889 | 1.000
1peptide
spectra
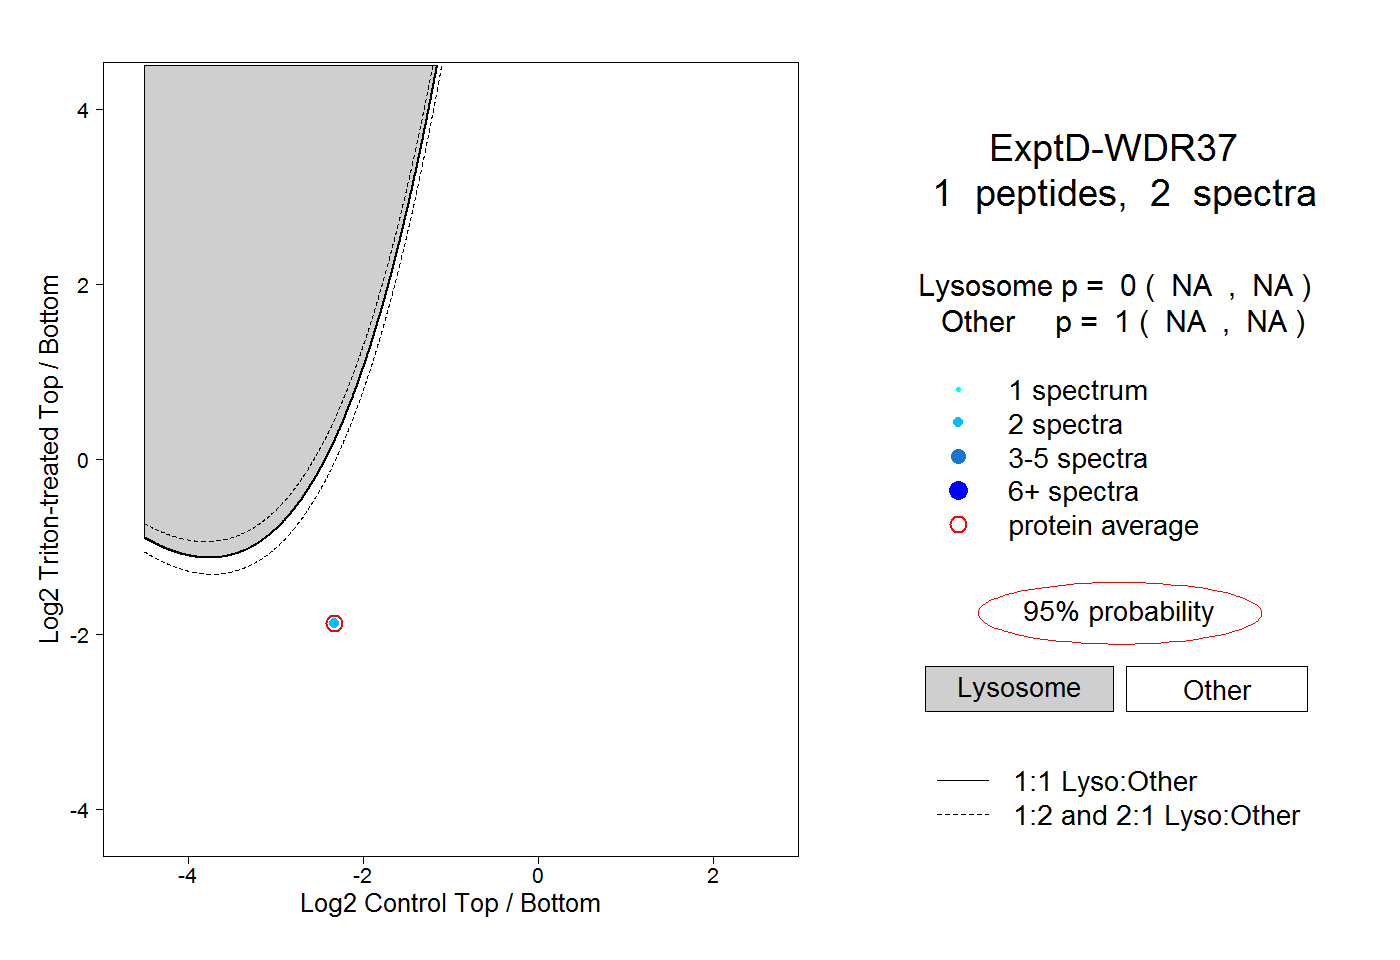
NA | NA
NA | NA