 7
7peptides
spectra
0.000 | 0.000
0.000 | 0.000
0.000 | 0.000
0.000 | 0.000
0.000 | 0.000
0.569 | 0.590
0.409 | 0.429
0.000 | 0.000
| Plot | Mito | Lyso | Perox | ER | Golgi | PM | Cytosol | Nucleus | |||||
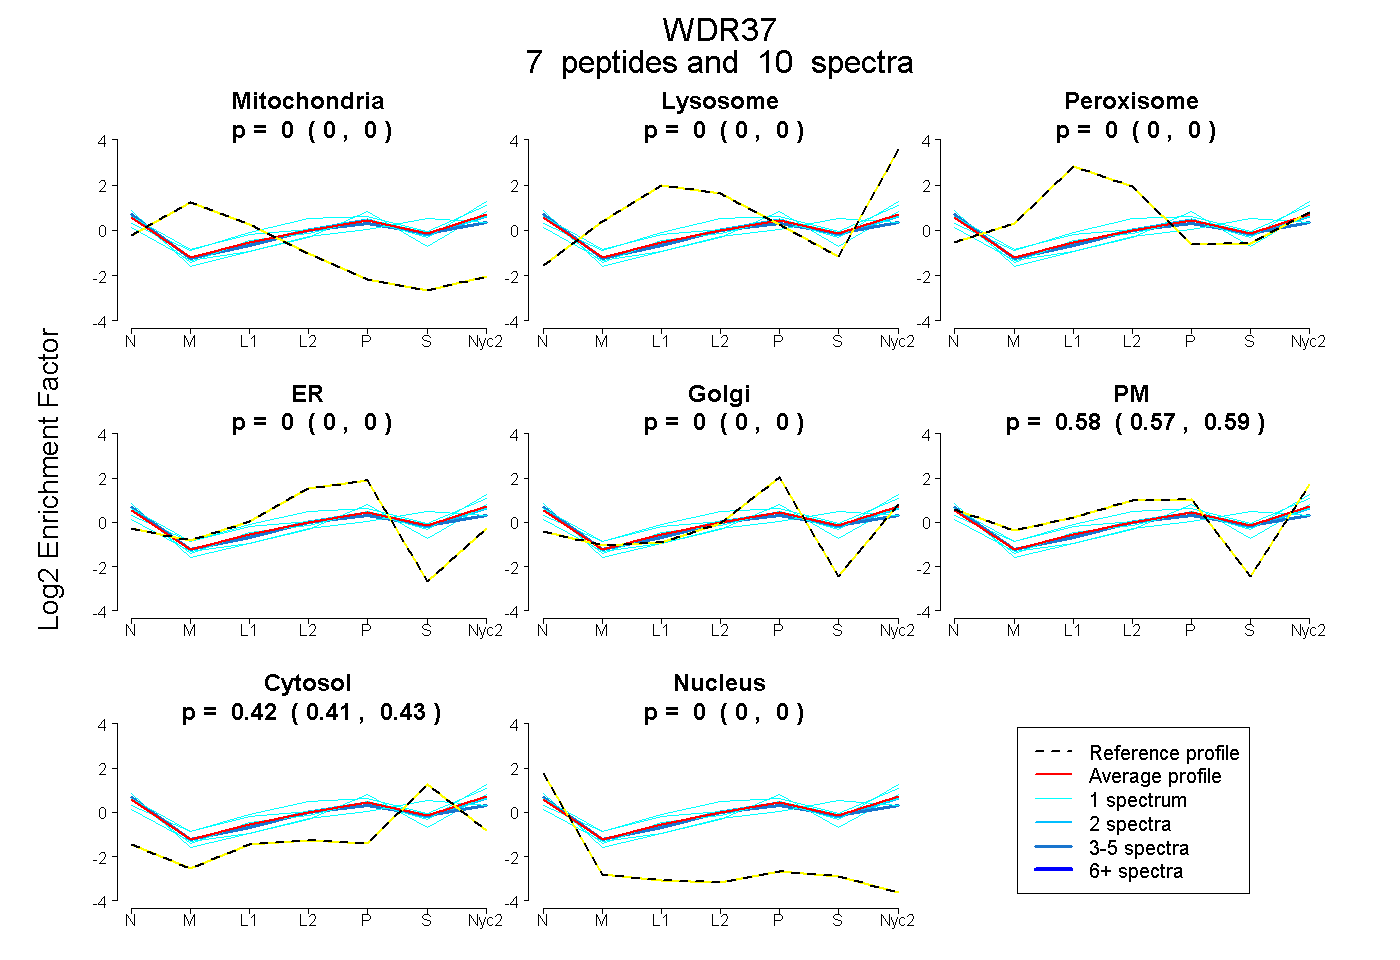
| Expt A |
7 peptides |
10 spectra |
|
0.000 0.000 | 0.000 |
0.000 0.000 | 0.000 |
0.000 0.000 | 0.000 |
0.000 0.000 | 0.000 |
0.000 0.000 | 0.000 |
0.580 0.569 | 0.590 |
0.420 0.409 | 0.429 |
0.000 0.000 | 0.000 |
| 1 spectrum, VPLTSLK | 0.000 | 0.000 | 0.000 | 0.000 | 0.000 | 0.561 | 0.439 | 0.000 | ||
| 1 spectrum, SPIATIR | 0.000 | 0.032 | 0.016 | 0.000 | 0.000 | 0.623 | 0.329 | 0.000 | ||
| 1 spectrum, EMLEGQDSK | 0.000 | 0.048 | 0.089 | 0.000 | 0.000 | 0.533 | 0.330 | 0.000 | ||
| 1 spectrum, QVVTASWDR | 0.000 | 0.000 | 0.000 | 0.000 | 0.000 | 0.422 | 0.578 | 0.000 | ||
| 3 spectra, LVVTSSR | 0.000 | 0.000 | 0.000 | 0.000 | 0.000 | 0.551 | 0.428 | 0.020 | ||
| 1 spectrum, LFDMSGVR | 0.000 | 0.000 | 0.000 | 0.000 | 0.185 | 0.465 | 0.302 | 0.049 | ||
| 2 spectra, DGIWDVSVAR | 0.000 | 0.000 | 0.000 | 0.000 | 0.000 | 0.591 | 0.409 | 0.000 |
| Plot | Mito | Lyso or Perox | ER | Golgi | PM | Cytosol | Nucleus | ||||||
| Expt B |
2 peptides |
2 spectra |
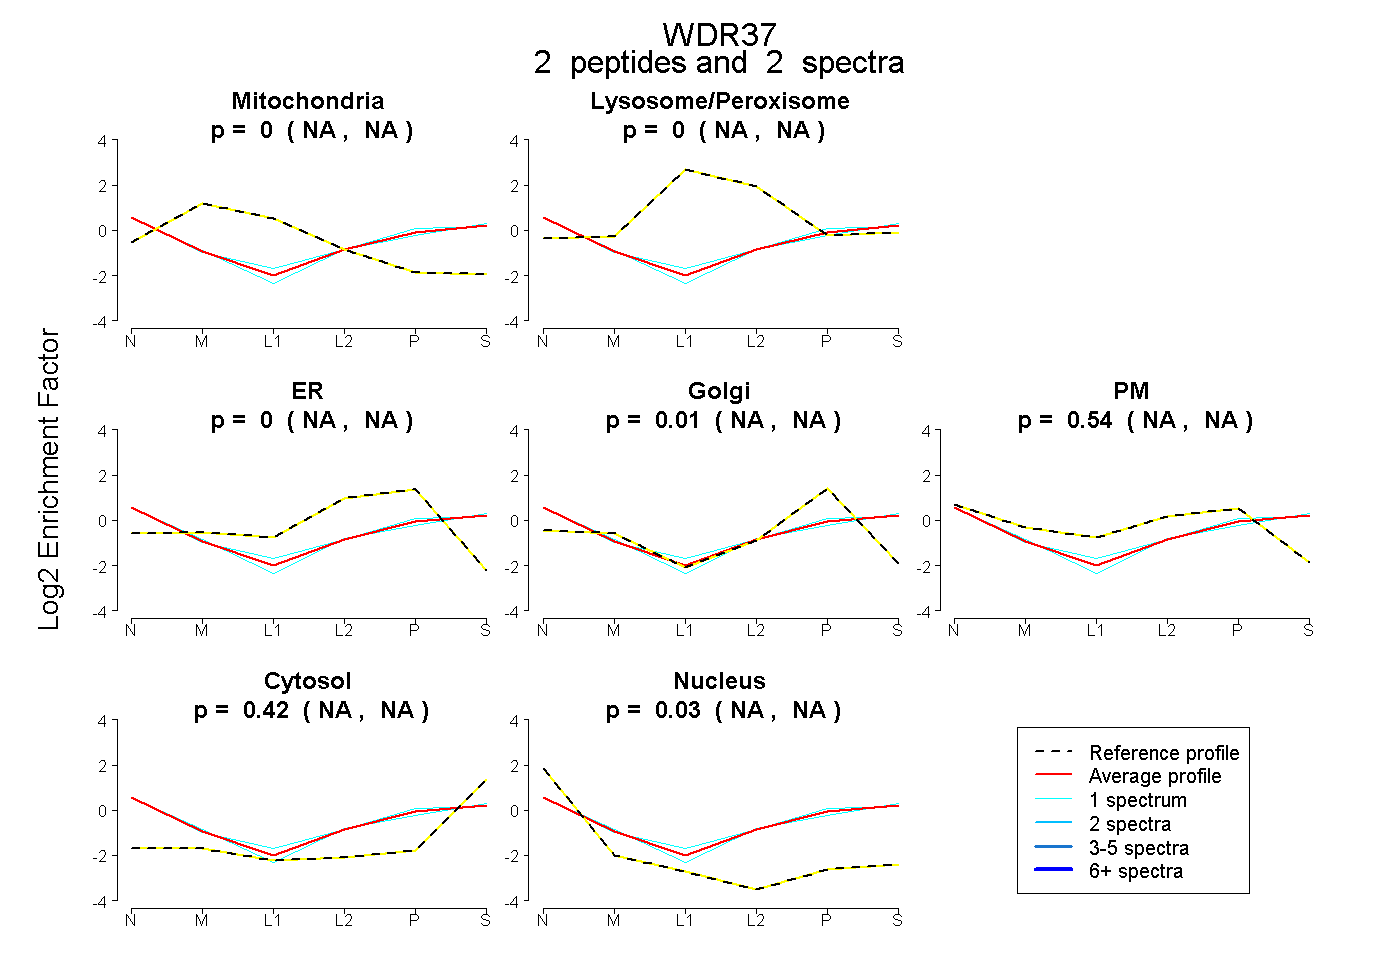 |
0.000 NA | NA |
0.000 NA | NA |
0.000 NA | NA |
0.012 NA | NA |
0.540 NA | NA |
0.422 NA | NA |
0.026 NA | NA |
|||
| Plot | Lyso | Other | |||||||||||
| Expt C |
3 peptides |
6 spectra |
 |
0.000 0.000 | 0.099 |
1.000 0.889 | 1.000 |
||||||||
| Plot | Lyso | Other | |||||||||||
| Expt D |
1 peptide |
2 spectra |
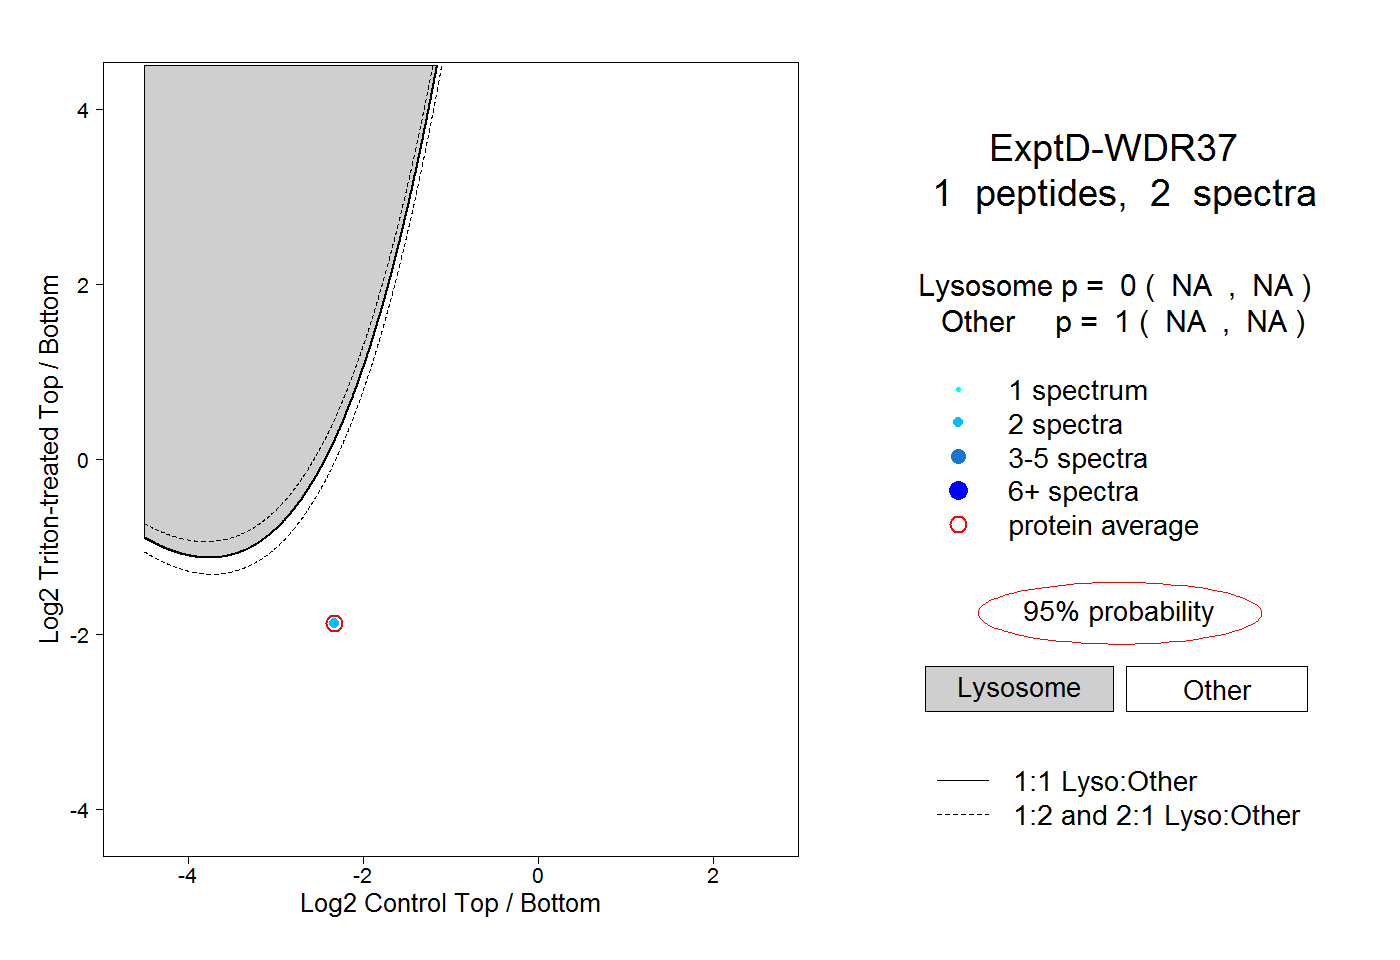 |
0.000 NA | NA |
1.000 NA | NA |